Explains how Potential Energy Savings Chart works.
The results shown in the Potential Energy Savings App are calculated from 37 whole building simulations performed on your model.
Each bar on the chart represents some subset of the simulation runs that focus on a specific building feature’s performance parameter.
The alternative runs are chosen to get a range of results that will fully describe the bar. This often means simulating extremes of low and high efficiency, or a representative range of options, and comparing it to the current model.
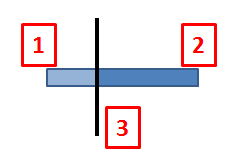
For each parameter:
1 = Worst energy performance of all the alternatives simulated for this parameter
2 = Best energy performance of all the alternatives simulated for this parameter
3 = Current base run energy model performance (vertical black line)
The Mass Runs Process
The process includes the following steps:
-
Building model created. If created in an architectural model tool (i.e, Revit or Vasari) it will contain the energy settings you're able to define in that authoring tool. However, the model is likely to be incomplete from an energy analysis perspective and parameters will need to be defined before a building model can be analyzed.
-
Green Building Studio receives your model. For any parameters necessary for analysis that were not specified in the authoring tool, Green Building Studio inserts appropriate default values based on your building type and location and runs an energy analysis of your model.
-
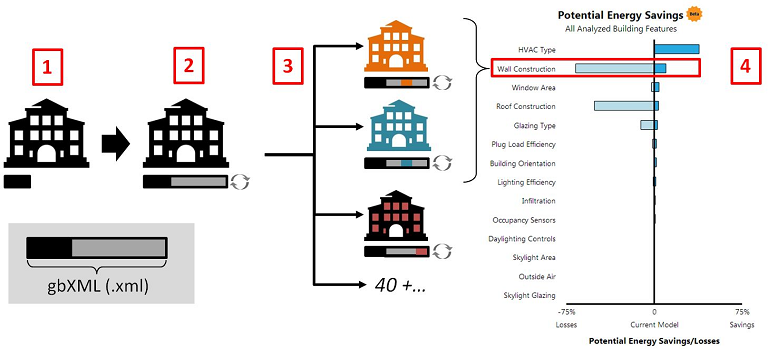
Green Building Studio then generates nearly 40 alternative designs that vary 9 building parameters, and simultaneously simulates those in the cloud. For more detail on how the runs are chosen, see Alternative Runs (Details).
-
The results of the nearly 40 simulations are stored on Green Building Studio, and also displayed in the Potential Energy Savings chart. Each bar on the chart is comprised of data from runs that vary a specific parameter from those nearly 40 runs. The building features with the largest potential for energy savings are displayed toward the top of the chart.