In this section, you perform a part fill simulation, which predicts the flow of plastic melt inside the mold during the filling process.
To do it, the flow front is calculated as it grows through the part incrementally from the injection location. The simulation runs until the velocity pressure switch-over point has been reached. There are two types of fill simulation: a Part Fill analysis evaluates individual parts, and a Mold Fill analysis evaluates the entire mold design, including the feed system. Before running a Part Fill analysis, the material and the part process settings must be defined, and at least one gate location must exist.
- On the ribbon, click Core/Cavity tab > Plastic Part panel > Part Fill Analysis
 .
. - Click Start on the Part Fill Analysis dialog box.
- Click OK on the Analysis running dialog box.
- Review the Summary dialog box.
The top of the Summary dialog box indicates that the part can be filled easily but part quality may be unacceptable. This information indicates to review the Quality prediction plot, determine the magnitude of the quality problems, and check whether the locations of these problems are critical to part performance. Additional fill analyses can be displayed to determine whether changes in variables, such as the process settings, gate location, and material, improve the results.
- Click Cancel to close the Summary dialog box.
- Right-click in the model window and click Home View to return the model to its default orientation.
- On the Mold Design browser, expand the MobileTopComplete > Results > Fill nodes. Six results were generated: Fill time, Plastic flow, Confidence of fill, Quality prediction, Air traps, and Weld lines.
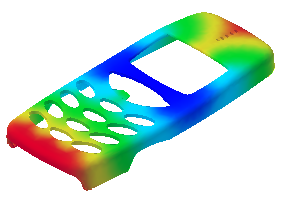
- Double-click the Fill time node. The model displays as shown in the following image.

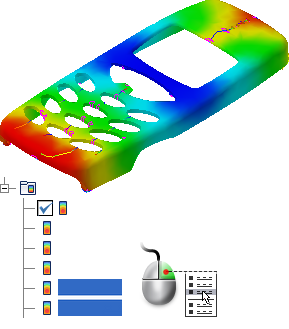
- Right-click the Air traps and Weld lines nodes in the browser and enable Overlay in the context menu. The fill time display now includes the air traps and weld lines as shown in the following image.

- You can enable each of these nodes individually or together to help visualize the model. Right-click the Air traps and Weld lines nodes in the browser and clear the Overlay selection.
- Use the color contour legend to review the color display on the model, which shows the fill time for each area.
The Fill time result shows the position of the flow front at regular intervals as the cavity fills. The color contour represents the parts of the mold that are being filled simultaneously. At the start of the injection, the flow front is represented in dark blue. The last places to fill are represented in red. An absence of color indicates sections that did not fill, that is, the part has a short shot.
The spacing between the contour lines, or width of the color bands, is an indication of the flow velocity. Because the time duration between each line or band is the same, the further apart the lines or bands are, the faster the flow front is moving. A part with a good fill time result has a balanced flow pattern. The following also applies:
- All the flow paths finish at the same time. The flow fronts should reach the extremities of the model simultaneously and each flow path should end with red contours. If one flow path finishes before the others, it may indicate overpacking.
- The contours are evenly spaced. The spacing indicates the speed at which the plastic melt is flowing. Widely spaced contours indicate rapid flow. Narrow contours indicate the part is filling slowly. Closely spaced contours indicate hesitation.
In this tutorial, the central location of the gate provides a nearly balanced fill pattern. The flow front reaches the top of the part slightly before the bottom. The flow velocity is high near the gate, and relatively high on the bottom of the part (below the keypad). These regions have high velocities because the flow front is not large compared to the rest of the part. Areas of high velocity tend to have higher shear stress.
- In the Mold Design browser, double-click the Quality prediction node. The model displays as shown in the following image.

The quality prediction result estimates the expected quality of the appearance of the part, and its mechanical properties. The quality predictions that are displayed are based on the following sliding scale:
- Green indicates high quality.
- Yellow indicates that there may be quality issues.
- Red indicates that there are quality issues.
Most of the display for this model is green, indicating high quality. The model is yellow in some areas, indicating there may be some quality issues that need further investigation. None of the areas that indicate quality issues are large.