After the simulation completed, the icon ![]() disappeared from the Results browser node. The results now reflect current inputs and simulation properties.
disappeared from the Results browser node. The results now reflect current inputs and simulation properties.
Also, a Modal Frequency folder was created under the Results browser node.
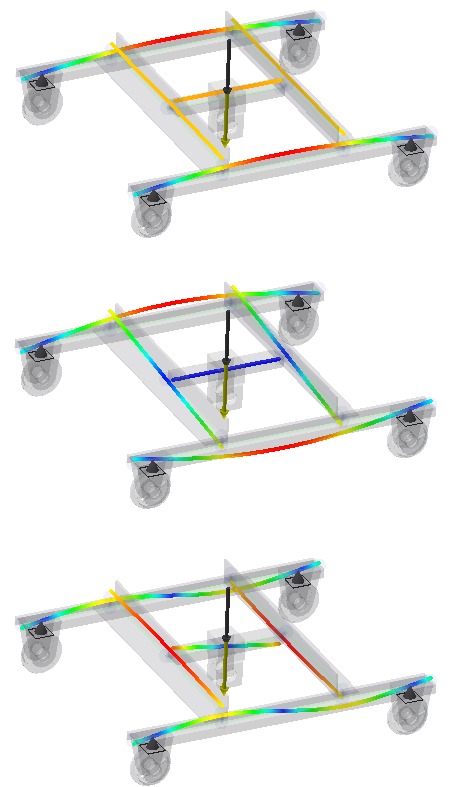
Expand the Modal Frequency folder to expose the list of available Mode Shapes corresponding to each calculated natural frequency. Double-click the frequency of choice to display it.
The following image shows the first three modal frequencies of the performed analysis.
