Again, the Results folder is populated with the results.
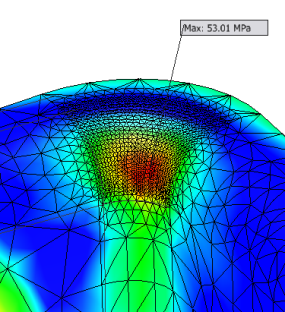
- Expand the Results node. By default, the Von Mises Stress plot displays.
- In the Display panel, click Show Maximum Result
 to display the location of the maximum result. Hide components, as needed, to see the exact location.

Maximum result values can be also shown in the Parametric Table for summary and comparison with other simulations. In this case, we will add a local constraint (maximum result value for a specific assembly component)
- In the Manage panel, click the Parametric Table
 command.
 - Right-click on a cell in the table, and click Add Design Constraint.
- Click Von Mises Stress
- Close the parametric table.
To compare result values in the Parametric table, simply check the corresponding boxes in the other simulation studies.