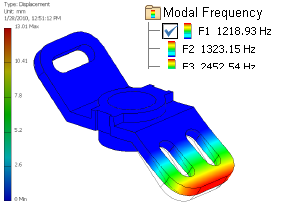
After the simulation finishes, the Results folder populates with the various results types. The graphics region displays the first mode shaded plot.
In the browser under the Results node and then the Modal Frequency node, notice the first mode shape (F1) has a check mark by it, indicating it is being displayed. There are nodes for the mode shapes corresponding to each natural frequency. The color chart shows relative displacement values. The units are not applicable since the mode shapes values are relative. (They have no actual physical value at this point.)
Now you can perform post-processing tasks using the Display commands located on the ribbon bar. The commands are described in Help.

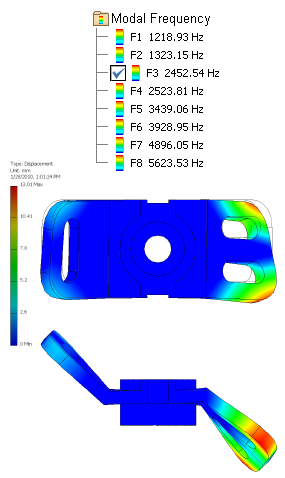
For post-processing of structural frequency simulation studies, the browser list shows the natural frequencies. Double-click any of these nodes to show the corresponding Mode Shape 3D plot.
- Animate the results using the Animate Results command in the Result panel on the ribbon bar.
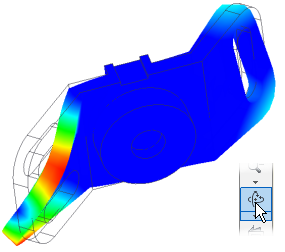
- While the animation is playing, click Orbit in the navigation tools on the side of the graphics window. As you orbit the graphics, the animation continues to play.Note: The following image depicts a frame from the animation of mode F3.

- Click OK.
- In the Results browser list of natural frequencies, double-click the results for mode F3 to display that mode.
