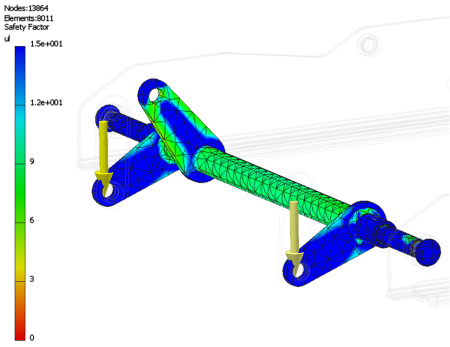
When the simulation completes its computations, the graphics region updates to show:
- 3D Volume plot and result type.
- Smooth Shading showing the distribution of stresses.
- Color bar indicating the stress range.
- Mesh Information including the number of nodes and elements.
- Unit information.
- Result browser node is populated with child nodes for the various results based on the analysis type.
For Static Analysis, the default result is Von Mises Stress and for Modal Analysis, the default is Frequency 1. View the results by using the display commands and the Results nodes in the browser. These tools help you visualize the magnitude of the stresses that occur throughout the component, the deformation of the component, and the stress safety factor. For modal analysis, you visualize the natural frequency modes.
Display commands are enabled and located in the Display panel of the Stress Analysis tab. The default display mode smooths contours.
The various results sets are seen by expanding the Result node to reveal the child nodes. For example, when you run a static analysis, child result nodes for Von Mises Stress, 1st principal stress, Displacement, Safety Factor, and so on, populate the browser.

To view the different results sets, double-click the browser node. While viewing the results, you can:
- Change the color bar to emphasize the stress levels that are of concern.
- Compare the results to the undeformed geometry.
- View the mesh used for the solution.
- Use Contour Shading.
- Display the Maximum and Minimum Results locations.
- Apply the same scale across results sets. Applicable when hiding various parts from the result view or when dealing with multiple configurations in parametric studies.
- Display the boundary conditions.
- Adjust the displacement display to enhance model deformation for graphical presentation.
- Animate the displacement through a series of steps.
- Create a video of the displacement animation.
- View 2D Convergence Plots (result accuracy curve).
- Probe for values at specific points.