The Output Grapher is the means to examine various results from the simulation. The following is a list of some of the things you can do after you run a simulation:
- Display vectors for internal or external forces
- Change reference frames to view results in various coordinate systems
- Display curve results
- Save the simulation results for later review and comparison
- Display results in terms of time or other criteria
- Display traces to visualize trajectory of component points.
Display traces
- After you run the simulation, and before you leave the run environment, click the Output Grapher command.
The Output Grapher window is divided into different sections: browser, graph, and time steps. There are Output Grapher specific commands in a toolbar across the top of the window. The window is resizable, so adjust it to meet your needs.
- Click Add Trace. The dialog box displays and the Origin selector is actively awaiting an input. Select the point at the end of the saw blade.

- In the dialog box, check the Output trace value option.

- Specify two additional trace points along the saw blade. Export the trace.
Set trace as reference
- In the Output Grapher browser, expand Traces.
- Expand Trace:1, and then Positions.
- Right-click P[X] and then click Set as Reference.
- Using the Output Grapher, Save command, save the Simulation.
- Enter the name Reciprocating Saw cam1.iaa. Click OK.
- Close the Output Grapher.
- In the Simulation Player, click Construction Mode.
Modify the cam component
- In the browser, under Mobile Groups, expand the Cam Crank assembly.
- Right-click the Cam lobe.ipt component and click Edit.
- Edit the sketch for the lobe extrusion.
- Double-click the dimension 5.08. Change the value to 1.0.
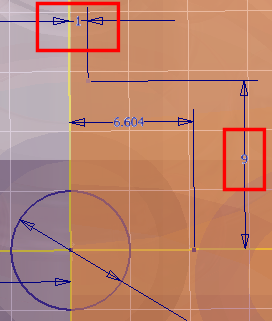
- Double-click the dimension 7.62. Change the value to 9.
- In the ribbon bar, at the far right, click Finish Sketch.
- In the same area of the ribbon bar, Click Return.
- in the Simulation Player, Click Run.
- Start the Output Grapher.
- In the Output Grapher toolbar, click Import Simulation.
- Select the file Reciprocating Saw cam1.iaa. The simulation data populates the Output Grapher browser.
- Expand the Reciprocating Saw cam1.iaa node and then expand Traces.
- Expand Trace:1 and then expand Positions.
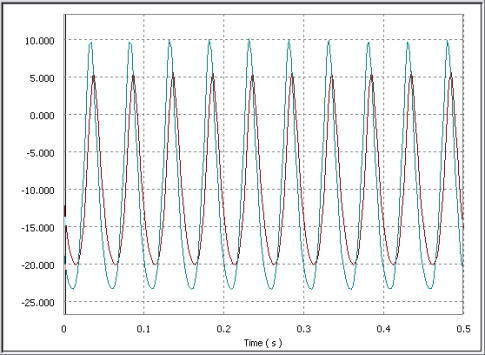
- Click P[Z] to display it over the other simulations Trace. You can compare simulation results in this way.
Export to FEA
- In the Output Grapher, Time Steps section, place a check mark beside several time steps that you want to analyze in the Stress Analysis environment.

- On the Output Grapher toolbar, click Export to FEA. The Export to FEA dialog box displays and the part selector is active.
- In the graphics window, click Follower:1.
- Click OK.
Select faces
- On the FEA Load-Bearing Faces Selection dialog box, Parts Selected section, click Follower:1.
- In the joints to complete section, click Prismatic:3 (Guide:1, Follower:1).
- In the graphics window, on the Follower part, select the face the slides inside the hole in the Guide component.
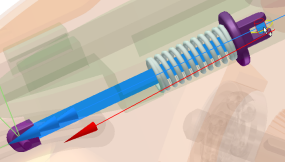
- On the dialog box, click Revolution:5 (Follower Roller:1, Follower:1).
- In the graphics window, on the Follower, select the cylindrical face where the Follower Roller component goes.
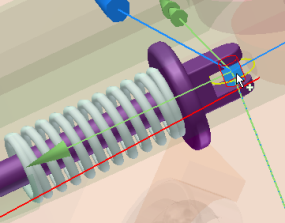
- On the dialog box, click Spring/Damper/Jack::7 (Guide:1, Follower:1).
- In the graphics window, on the Follower, select the face where the spring joint meets the follower.
- On the dialog box, click OK.
Select time steps
- Run a simulation.
- In the time steps pane of the Output Grapher, click the 0.095 s, 0.2375 s, and 0.3925 s time steps.
- Close the Output Grapher.
- In the ribbon bar, click Finish Dynamic Simulation.
Import motion load into stress analysis
- On the ribbon bar, click Environments tab
 Stress Analysis.
 - On the Stress Analysis tab, click Create Simulation.
- In the dialog box, Static Analysis section of the Simulation tab, check the Motion Loads Analysis option.
The Part and Time Step lists enable. The Part list contains those parts that were exported for FEA. You can export more than one component and create different simulations for each component.
The Time Steps list contains those time steps you selected for export.
- From the Time Step list, select time step 0.2375 and click OK.
In the graphics window, the Follower component is the only component available for the simulation, all others are excluded.
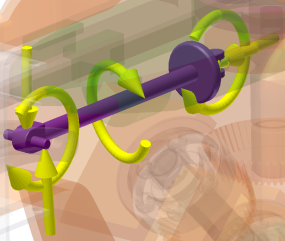
- Expand the Loads node in the browser. There are many forces involved in the components operation. These forces are displayed in the graphics region as well. You can suppress any force you do not want active in the simulation. To see the impact of any single force, suppress the other forces.
- In the Solve panel, click Simulate. The simulation can take some time to solve. The Von Mises Stress result displays when the simulation is complete.
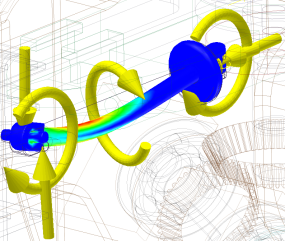
- Expand the Results node and double-click the results you are interested in seeing.
- Click the Simulation tab and then click Dynamic Simulation.