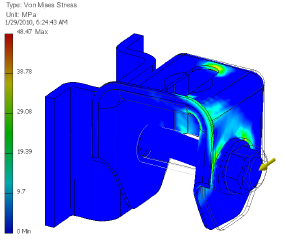
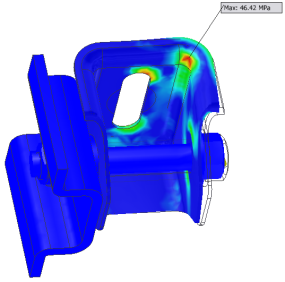
After the simulation finishes, the Results folder is populated with the simulation results and the graphics region updates to display a results plot.
- Expand the Results folder. By default, the Von Mises Stress plot displays.

- In the browser, the current result plot has a check mark by the node icon. To activate other plots, double-click the particular plot node you are interested in seeing. The display updates to present that plot.
Now you can perform post-processing tasks. For example, viewing the results with smooth shading or contour plots.
- In the Display panel, click Show Maximum Value
 .
.
- Using the view commands, reorient the model so you can see the maximum value area.
- If the maximum value location is obscured by other components, you can hide those components. In the browser, right-click the components and click Visibility.
Maximum values can be also shown in the Parametric Table for summary and comparison with other simulations. In this case, we will add a Design Constraint, maximum result value, for the assembly.
- In the Manage panel, click Parametric Table .

- In a table cell, right-click and click Add Design Constraint. The Select Design Constraint dialog box displays.
- Click Von Mises Stress.
- Click OK.
We have concluded the first simulation. The second simulation uses most of the items defined in this first simulation. The simulation study will be duplicated and modified as required for the additional study.