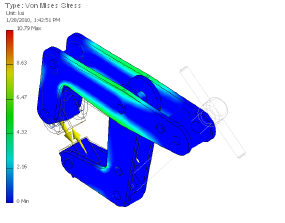
After the simulation completes, the graphics display presents the Von Mises Stress results plot. The complete set of results is posted in the Results folder.
There are various commands for viewing result data. Most are located in the Result and Display panels.
- In the Display panel, click Show Maximum Value
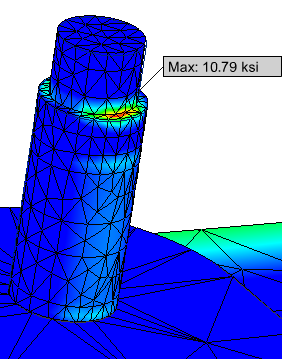
 . In the graphics window, a label with a leader points to the location of the maximum value. In this example, the maximum value is obscured by other components.
 - Expand the assembly browser node to view the list of components.
- Turn off visibility of the parts hiding the stress location.
- Lower Plate:1
- Upper Plate:1
Right-click each component, and click Visibility.
- Rotate and Zoom as needed to view the location of the Maximum Value.

Double-click the various results nodes to display the results in the graphics window.