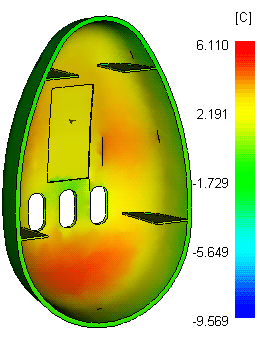
The Temperature variance result highlights areas where the part geometry and the cooling system will cause the surface temperature to be different from the average part temperature, which is taken at the end of the cycle.
Red indicates areas that are hotter than average and blue indicates areas that are colder than average.

Using this result
The Temperature variance result displays the effect of the part's shape on its surface temperature. Thick sections and heat traps, such as small enclosed areas, also affect the way that the polymer cools so this result should be read in conjunction with the Cooling time variance result.
Things to look for
Red areas in the Cooling quality result may stem from large variations in surface temperature. If this is the case, use the Temperature variance result and the following suggestions to investigate the cause.
| Temperature variance significantly negative | Possible problems |
|---|---|
| Increase the thickness in the area to reduce the rate of cooling. | May cause a functional problem with the design, and may increase the time it takes to freeze. |
| If the problem is caused by hesitation, address the causes of the hesitation. | May cause a functional problem with the design. |
| Consider using hotter coolant in this region when designing the mold. |
| Temperature variance significantly positive | Possible problems |
|---|---|
| Reduce part thickness locally. | May cause a functional problem with the design. |
| Consider adding more cooling channels and/or using colder coolant in this region when designing the mold. |