When reviewing an Autodesk® 360 Energy Analysis in the Results and Compare dialog, a wind rose provides a graphical display of wind speed and direction data. These wind roses use 16 cardinal directions.
To achieve carbon-neutral and net-zero energy design, buildings must be responsive to their local climates. By studying the prevailing wind patterns for a location, designers can make informed decisions about natural ventilation strategies, locating wind turbines appropriately, and shielding buildings from cold winter winds.
Designers typically use wind roses, in conjunction with solar insolation plots and climactic studies, to determine how to orient a building on a site. If the prevailing summer wind in a mild climate is from the southeast, a designer can use this information when considering window placement for natural ventilation.
Annual Wind Rose (Speed Distribution)
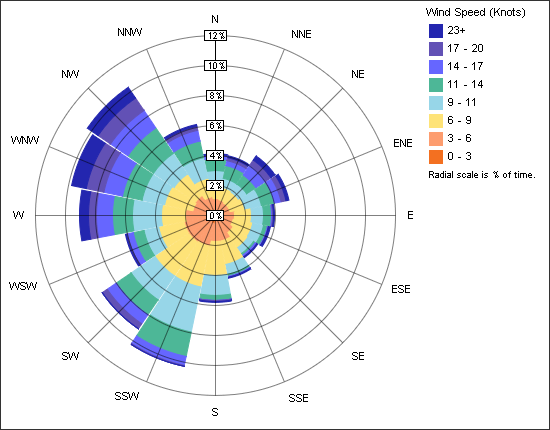
This chart shows the frequency and speed of wind blowing from each direction.

As you move outward on the radial scale, the frequency associated with wind coming from that direction increases. Each spoke is divided by color into wind speed ranges. The radial length of each spoke around the circle is the percentage of time that the wind blows from that direction.
In the sample Speed Distribution wind rose above (an annual wind rose from Boston, Massachusetts), winds from the NW and SSW directions are most common (more than 10% of annual hours). Of the winds from the SSW direction, wind speeds are most often in the 6-9 and 9-11 knot range (yellow and light blue).
Annual Wind Rose (Frequency Distribution)
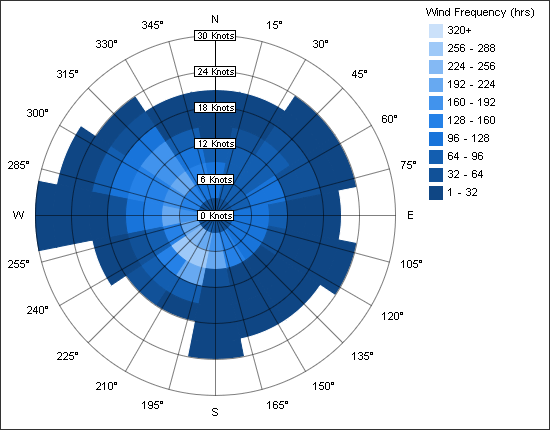
This wind rose shows the same data as the Speed Distribution wind rose, except the radial scale now represents wind speed rather than percent of time. Also, the colored segments of each spoke represent hours rather than wind speed.

Monthly Wind Roses
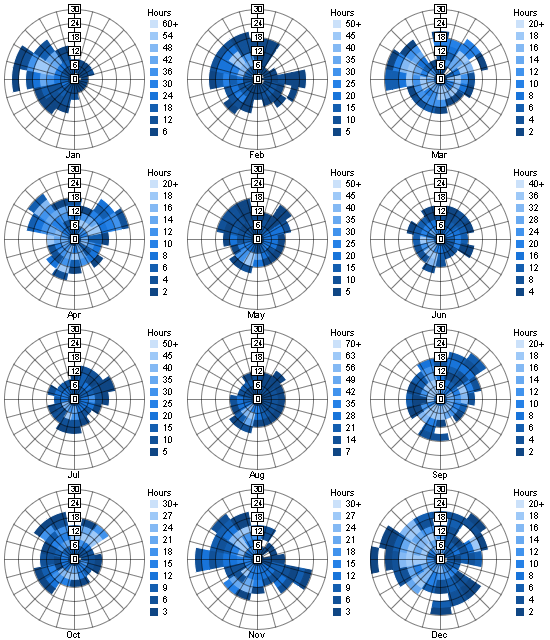
These wind roses show frequency distribution for each month of the year.
