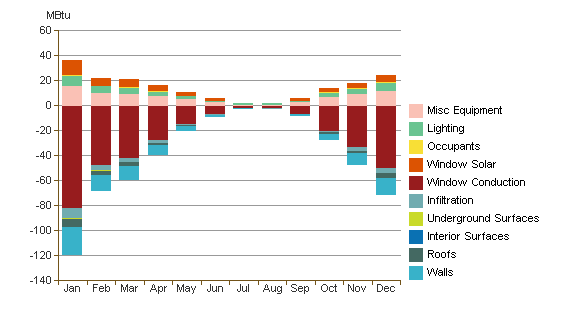
When reviewing an Autodesk® 360 Energy Analysis in the Results and Compare dialog, this chart shows the cumulative heating loads on the analyzed model for each month.

Example: In the sample chart above, the largest negative value for January is Window Conduction. Therefore, heat loss from conduction through windows represents the largest single monthly demand for heat in January. However, Miscellaneous Equipment (which includes plug loads, computers, office equipment, and so on) reduces the demand for heat.
To reduce the heating load on the project, use the graph to identify the critical component. In this example, windows cause the greatest amount of heat loss. Roofs and walls result in a significantly smaller amount of heat loss. Therefore, you should focus on the windows and reduce their U-value to reduce the heating load.