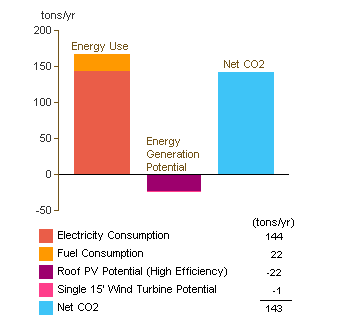
When reviewing an Autodesk® 360 Energy Analysis in the Results and Compare dialog, this graph summarizes the estimated CO2 emissions associated with energy consumption for the analyzed model. The graph illustrates the following equation:
Energy Use CO2 — Energy Generation Potential CO2 = Net CO2

To calculate CO2 emissions for projects in the United States, Autodesk uses utility emissions data from the U.S. Environmental Protection Agency (EPA), which has historical records for all U.S. power plants. For projects outside the U.S., Autodesk uses Carbon Monitoring for Action (CARMA) data.
Emissions data for a project is based on the on-site fuel use and the fuel sources for the electricity in the region. For example, a project located in a region with electrical power plants powered by coal has higher CO2 emissions per kilowatt-hour of electricity consumption than the same project located in a region where electrical power plants are powered by hydroelectricity.
| Parameter | Description |
|---|---|
| Energy Use | The estimated annual CO2 emissions for electricity and fuel consumption for the analyzed model. |
| Energy Generation Potential | A negative number representing tons of carbon you can potentially remove from the project by using renewable energy rather than obtaining power from the electricity grid. This value includes on-site renewable potential from the Roof PV Potential (solar electric) and the Wind Turbine Potential (one turbine) for the project, based on its climate and geometry. |
| Net CO2 | Total CO2 emissions from the project's energy consumption, minus the Energy Generation Potential. |