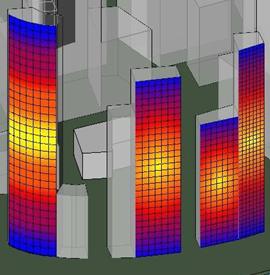
Create and apply display styles to visualize the results of analyses.
Tools for analysis visualization framework use an API to interpret analyses performed by add-in applications. These applications can help predict the effects of various structural and environmental forces. You can create display styles to concurrently visualize these multiple calculated results. These can be created independently and applied to an analysis at a later time.
For example, you may want to study how applied loads affect a floor beam. Use the analysis add-in application to analyize and return results as a set of points with associated values. You can create styles to visualize these results so that you can see at which point a beam is over-stressed.
