Note: Available as an Autodesk® Subscription Benefit.
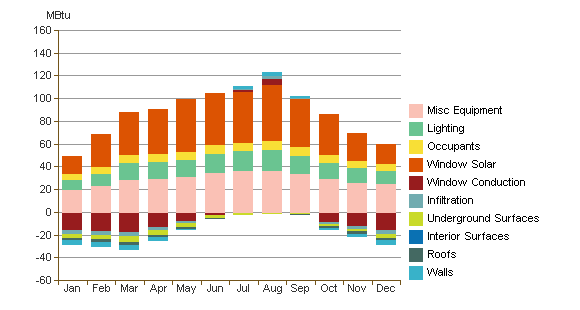
When reviewing a Autodesk® 360 Energy Analysis in the Results and Compare dialog, this chart shows the cumulative cooling loads on the project for each month.
- Positive values represent cooling demands that must be satisfied by a cooling system or other means.
- Negative values offset the need for cooling. For example, conduction through a closed window may provide some cooling to a building at night if the ambient temperature is low enough.

Note: This chart does not represent the peak cooling load used for sizing of cooling equipment. The chart also does not represent cooling loads caused by ventilation air, which can have a significant impact in densely occupied buildings.
Example: In the sample chart above, the largest cumulative cooling loads occur in August, with the greatest contribution from Window Solar, or radiant solar heat gain through windows. However, heat gains through walls are small by comparison. Therefore, you should improve the glass by reducing the windows’ Solar Heat Gain Coefficient (SHGC) before investing in improvements to the wall insulation value.