For this plastic snap-fit clip assembly, we will determine and graph the stress as a function of time throughout the analysis event as the two parts are pushed together. Because the clip is symmetrical about two planes, the model is a quarter-symmetry representation of the assembly.
Before you begin, please watch this short video that demonstrates the steps of the tutorial:
To start, download the model archive by clicking here. Save this file to a folder on your computer, and unzip the contents.
Open the Model
- Locate the file Snap-Fit-Clip.ach using your Windows file browser and double-click the file to launch Simulation Mechanical 360.
- You will be prompted to select the folder where you want the extracted model files to be located. The default location is the folder where the archive file resides.
- Click OK. The model appears in the FEA Editor environment and should look like this:
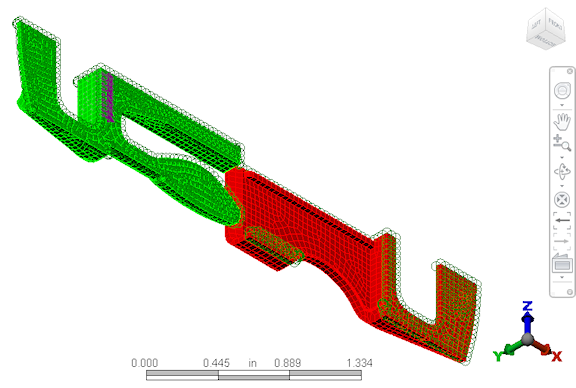
The model has already been meshed and set up with the following material, constraints, contact pairs, and analysis parameters:
- Mesh size: 0.04 inch
- Material: Plastic - Polycarbonate (Molded), both parts
-
Constraints:
- Prescribed displacement of 1.225 inches in the X-direction on Part 1 (indicated by purple arrows)
- Constrained against translation in the X-direction at flat rectangular surface on Part 2 (corresponds to location of prescribed displacement on Part 1)
- Y-symmetry constraints on surfaces lying along the XZ plane
- Z-symmetry constraints on surfaces lying along the XY plane
- General surface-to-surface contact: Defined between appropriate pairs of contact surfaces
- Event Duration: 1 second
- Number of time steps: 25
Analyze the Model
We are now ready to analyze the model.- Click
 Analysis
  Analysis Run Simulation.
 - As the analysis runs, the results are displayed in the Results environment. The analysis will take about 5 to solve, plus the time to transmit the model to the cloud and the results from the cloud to your computer. Thus, the total time is dependent upon the speed on your Internet connection.
- You will be sent an email message notifying you that the analysis has completed (assuming you completed the instructions under Cloud Notification Setup on the Introduction page. This feature is useful for large or complex analyses that may complete while you are not at the analysis workstation.
Reviewing the Results
The displacement magnitude values appear by default. We will display the von Mises stress results and animate them. We will also plot the time history of the maximum von Mises stress.
Click ![]() View Visibility Loads and Constraints to hide the load and constraint symbols.
View Visibility Loads and Constraints to hide the load and constraint symbols.
- Click
 Results Contours Stress von Mises.
 - Click
 Results Contours Load Case Options Load Case Middle to see the stresses at the middle of the event time. You should see this:
 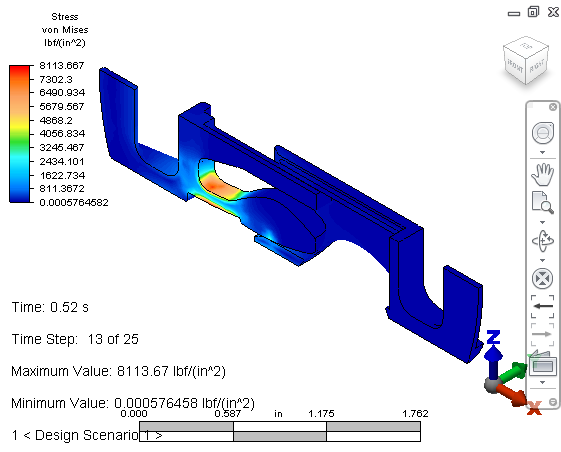 Note: You can also use the
 Next and
  Previous commands to progress through the various time steps.
 - Click
 Results Contours Captures Start. The results animate continuously. By default, the legend range automatically updates with each time step so that nearly every frame shows a full range of colors, from blue to red.
 - Click
 Results Contours Captures Stop to stop the animation.
- Click
- Click
 Selection Select All to select all of the surface nodes in the model. This command is within the pull-out section of the Select panel.
 - Right-click in the display area and choose the Edit New Graph command from the context menu.
- In the Edit Curve dialog box, choose Maximum from the Multiple Nodes drop-down box. Each data point on the resultant graph indicates the maximum stress level at each time step. Therefore, different data points may represent different locations on the model.
- Click the red X (
 ) in the upper right corner of the Edit Curve dialog box to close it. The graph appears:
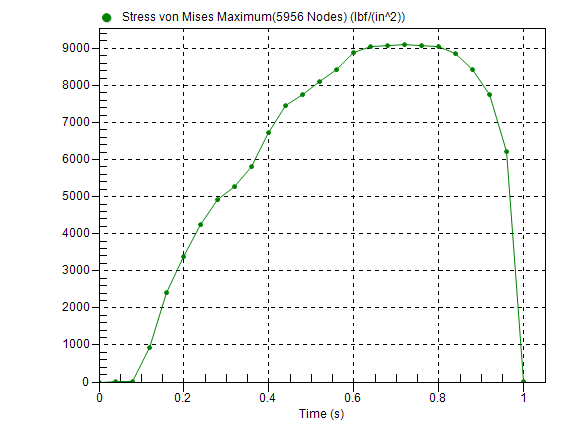
Good job! This completes the Snap-Fit Clip model.
Next Steps
In this exercise, the model was already set up. If you want to go through the steps yourself and learn more about Mechanical Event Simulations in Autodesk® Simulation Mechanical, click here.
To explore a Linear Static analysis or learn about Autodesk Simulation Mechanical resources, here.