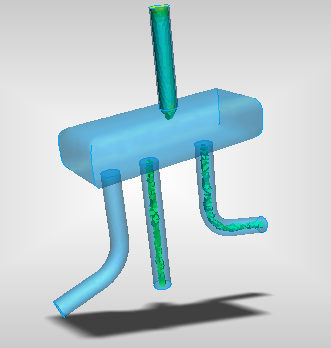
Use Filtering to visualize where a result quantity occurs within a specified range.

Some examples where Filtering is very useful include:
- In an electronics application, use Filtering to identify components and regions whose temperatures fall outside of a "safe" range, and are in danger of failing.
- In a valve application, use Filtering to identify regions where the velocity is highest, which may lead to undesired turbulence.
Filtering is conceptually similar to Iso Surfaces, with two important differences:
- Instead of a surface that is based on a single results value, Filtering shows a volume that is based on a range of results values.
- In addition to the Filter volume, the entire model is displayed. This makes it easier to identify the location of the region relative to the entire design.
While Filtering is enabled, the primary display controls (on the View toolbar) affect the filter volume.
To enable Filtering
- Right click off the model, and select Filter control...
- Check Enable filtering.
To change the Filter range
- Adjust the range with the Min and Max sliders.
- To reverse the Filter range, check Invert. This causes the filter range to fall outside of the specified range set by the sliders.
To change the Filter volume appearance
- Use the display icons (Shaded, Outline, etc.) in the View toolbar.
- To hide the filter volume, middle-click on it. (Alternatively, right click on the volume, and select Hide.)
To change the model appearance
By default, the model is displayed transparently.
- To hide the model, uncheck Show background model.
- To change the appearance of the model, select the desired option from the Draw style menu.
- To change the transparency level, drag the Transparency slider.
Related Topics