Use Analysis Analysis Optimization in the FEA Editor or Results environment to access the Design Optimization dialog. After a design optimization analysis has been performed, use the Results pull-down menu. The Results section is used to view graphs of the optimization history and sensitivity of the objectives to the design variables. Each of the options are described below.
Results: Design Variable Sensitivity:
The results of a Design Study can be viewed with the Results: Design Variable Sensitivity menu. Three kinds of graphs are available:
- Design Sensitivity. When this option is chosen, a bar chart of the sensitivity of the selected objective is shown for each design variable (bar). The value on the ordinate, Sensitivity, represents the change in the objective (in the same units as the objective) for a positive change in the design variable on the abscissa by one unit. Use the Objective/Constraint drop-down to select which objective the graph is for.
For example, if the objective is maximum displacement, then the graph will show how the displacement is affected by changing each design variable. If the sensitivity is negative, the objective will decrease by the amount shown by increasing the design variable. In Figure 1, the affect on the maximum displacement by increasing each of four design variables by one unit is shown. Changing design variable 1 has the largest effect on reducing the displacement.
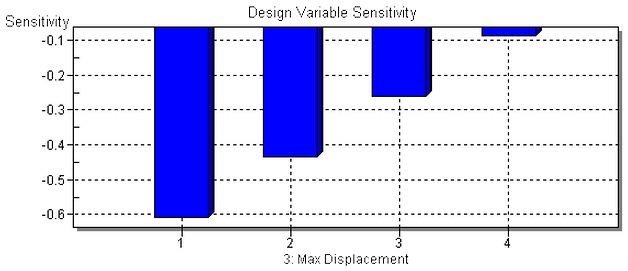
Figure 1: Design Sensitivity Graph
- DoE. When the Design of Experiment (DoE) option is chosen, a line graph of the selected objective is shown for all design variables at three values: the lower limit (abscissa point 1), the current value (point 2), and the upper limit (point 3). All three of these entries are entered in the Design Variable tab. The value for a given point is based on the value for that design variable (lower limit, current value, or upper limit) and the current value for all the other design variables. For example, the maximum displacement of 0.58 in Figure 2 occurs with design variable 1 set to the lower limit and the other 3 design variables set to the current values.
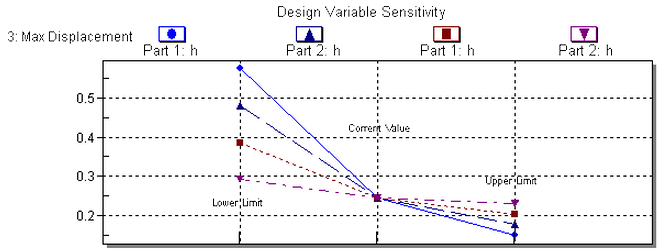
Figure 2: Design of Experiment Graph
- Single DoE. This option is similar to the DoE option. Instead of plotting all the design variables, only one design variable is plotted.
Results: Design Optimization History
The results of a Design Optimization can be viewed with the Results: Design Optimization History menu. A line graph is shown for the select objective of design variable at each iteration. Be sure to check the objective being minimized (or maximized); it should appear to be converged if sufficient iterations were specified.
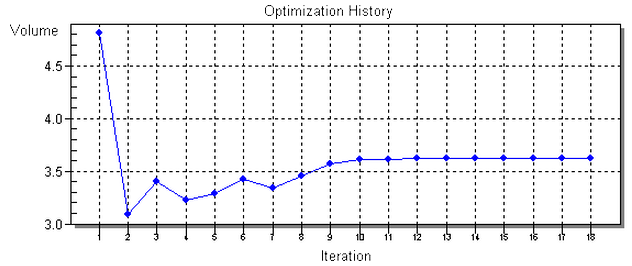
Figure 3: Optimization History for Volume
Results: Optimum Result
Selecting this menu option will open a new instance of Autodesk Simulation and display the results of the optimized model. All the settings in this optimized model are the same as entered by the user, but with each of the design variables set to the optimum value.