The definition of thermal comfort, according to the ASHRAE Standard 55-2004, is this:
The condition of mind that expresses satisfaction with the thermal environment, and is assessed by subjective evaluation.
Thermal comfort is an important consideration in the design and layout of dwellings that are occupied by people. Examples of such spaces include offices, homes, libraries, stadiums, and department stores. It is a way to characterize specific conditions in which a known fraction of occupants will find the environment thermally acceptable. Several factors are considered when assessing thermal comfort:
|
Environmental factors |
Personal factors |
|
Temperature |
Activity Level |
|
Thermal radiation |
Clothing |
|
Relative humidity |
|
|
Ambient air velocity |
The environmental factors are computed by simulating the flow and heat transfer within the enclosure. Relative humidity and the personal factors are specified quantities.
Simulating thermal comfort
Because thermal comfort is derived from the flow and heat transfer results computed by Autodesk Simulation CFD, it can be enabled either before running or after the solution is complete.
Basic analysis considerations
Flow:
- Breeze (external wind/wake) and/or vent velocity: specify either a velocity or volumetric flow rate
- If buoyancy is a consideration due to thermal gradients, select Variable on the Environment dialog.
- Specify a pressure boundary condition at outlets (vent returns)
Thermal:
- Specify the air temperature at all inlets. This is required.
- Specify U-values on windows and walls (as needed) as solid material thermal conductivities.
- Specify known heat generation boundary conditions on lighting, electronics, and equipment. Do not specify temperatures on components that will be solved for in the simulation.
- Specify film coefficients (as needed) to exterior surfaces to simulate heat transfer with the surrounding environment. (External wall surfaces that do not have an applied heat transfer boundary condition are treated as perfectly insulated.)
- Assign a heat generation boundary condition on the human forms. This is needed to simulate the amount of heat each human dissipates. The Metabolic rate table below lists heat generation rates for a range of activities.
On the Solve dialog, enable both Flow and Heat Transfer. Radiation is optional.
To enable Thermal Comfort prior to running an analysis:
- On the Control tab of the Solve dialog, click the Results quantities button.
- Check the Thermal comfort box.
- To define the characteristics of the environment, click the adjacent Factors button.
To enable Thermal comfort for a completed analysis:
- Enable the Thermal comfort result quantity as described above.
- On the Control tab of the Solve dialog, leave the Continue From field at the last iteration.
- Set the Iterations to run to be 0, and click Solve.
The analysis will appear to start, but will not solve any additional iterations. The thermal comfort results are then computed and made available for visualization.
Thermal comfort factors
Metabolic rate
The metabolic rate characterizes the energy generated inside the body due to metabolic activity. The standard unit for metabolic rate is the met.
1 met = 58.2 W/m² (18.4 BTU /h ft²).
A single met is approximately the amount of energy produced per unit surface area of a person of average stature, seated at rest. (The surface area of the average person is about 1.8 m² (19 ft²). The Autodesk Simulation CFD units of Metabolic rate are W/m², and the default value is 60 W/m².
Note that this value must be specified in addition to the heat generation boundary condition applied to each human form. (The heat generation boundary condition is needed to compute an accurate temperature solution. Autodesk Simulation CFD uses both the temperature distribution and the specified Metabolic rate factor to compute the thermal comfort.)
Metabolic rates for several activities and situations
|
Activity |
Metabolic Rate (W/m²) |
|
Sleeping |
40 |
|
Reclining |
45 |
|
Sitting quietly |
60 |
|
Standing |
70 |
|
Walking slowly (0.9 m/s, 3.2 km/h, 2.0 mph) |
115 |
|
Walking moderately (1.2 m/s, 4.3 km/h, 2.7 mph) |
150 |
|
Walking briskly (1.8 m/s, 6.8 km/h, 4.2 mph) |
220 |
|
Seated, reading, or writing |
60 |
|
Typing |
65 |
|
Filing (seated) |
70 |
|
Filing (standing) |
80 |
|
Walking about an office |
100 |
|
Lifting/packing |
120 |
|
Dancing |
140-255 |
|
Exercise / calisthenics |
175-235 |
|
Playing tennis |
210-270 |
|
Playing basketball |
290-440 |
Clothing
The clothing worn by the occupant plays a significant role in the perceived thermal comfort level. A heavy coat in the middle of summer is very uncomfortable, but is quite appropriate in winter!
Clothing is quantitatively expressed in units of "clo." A clo is the thermal insulation provided by garments and clothing ensembles:
1 clo = 0.155 m2 °C/W (0.88 ft2·h·°F/Btu).
Clo value table for a variety of clothing ensembles
|
Clothing Ensemble |
clo value |
|
Trousers and short-sleeve shirt |
0.57 |
|
Trousers and long-sleeve shirt |
0.61 |
|
Trousers, long-sleeve shirt, and suit jacket |
0.96 |
|
Trousers, long-sleeve shirt, suit jacket, vest, and T-shirt |
1.14 |
|
Trousers, long-sleeve shirt, long-sleeve sweater, and T-shirt |
1.01 |
|
Trousers, long-sleeve shirt, long-sleeve sweater, T-shirt, suit jacket, and long underwear bottoms |
1.30 |
|
Knee-length skirt and short-sleeve shirt, with sandals |
0.54 |
|
Knee-length skirt, long-sleeve shirt, and full slip |
0.67 |
|
Knee-length skirt, long-sleeve shirt, half slip, and long-sleeve sweater |
1.10 |
|
Knee-length skirt, long-sleeve shirt, half slip, and suit jacket |
1.04 |
|
Ankle-length skirt, long-sleeve shirt, and suit jacket |
1.10 |
|
Walking shorts and short-sleeve shirt |
0.36 |
|
Long-sleeve coveralls and T-shirt |
0.72 |
|
Overalls, long-sleeve shirt, and T-shirt |
0.89 |
|
Insulated coveralls, long-sleeve thermal underwear tops and bottoms |
1.37 |
|
Sweat pants and long-sleeve sweatshirt |
0.74 |
|
Long-sleeve pajama tops, long pajama trousers, short 3/4 length robe (slippers, no socks) |
0.96 |
All clothing ensembles, except where noted, include shoes, socks, and briefs or panties. All skirt/dress ensembles include pantyhose and no additional socks.
Humidity
Specify the relative humidity (as a percentage) of the room or space.
Assessing thermal comfort results
At the fundamental level, thermal comfort is the computation of a heat transfer energy balance. The heat transfer contributions of radiation, convection, and conduction are balanced against the heat generated by the occupant. Other factors such as relative humidity and occupant clothing play a role as well.
A simple expression of thermal comfort in terms of the heat entering or leaving the occupant is this:
- If heat leaving > heat entering, the occupant is cold.
- If heat entering > heat leaving, the occupant is hot.
The result of a thermal comfort calculation is an assessment of whether the occupant is too cold (negative thermal comfort) or too hot (positive thermal comfort) The available results quantities are the Mean Radiation Temperature, the Predicted Mean Vote, and the Predicted Percentage of Dissatisfaction.
Mean Radiant Temperature (MRT)
Mean radiant temperature (MRT) is the temperature that is achieved when the occupant absorptivity and emissivity are that of a radiative black body. It is the area-weighted mean temperature of all the objects surrounding the body.
Plot MRT as a global scalar, on results planes, and with iso surfaces to visualize the temperature distribution throughout the occupant space.
Predicted Mean Vote (PMV)
PMV is an index that predicts the mean value of the votes of a large group of persons on the seven point thermal sensation scale:
|
Value |
Sensation |
|
-3 |
cold |
|
-2 |
cool |
|
-1 |
slightly cool |
|
0 |
neutral |
|
+1 |
slightly warm |
|
+2 |
warm |
|
+3 |
hot |
Use PMV to assess the impact of the room design on the occupants. The best way to display PMV is on the surfaces of the model. To plot PMV, right click off the model, select Global result, and select it from the menu.
In the image, velocity is plotted on the results plane, and PMV is plotted on the surfaces:
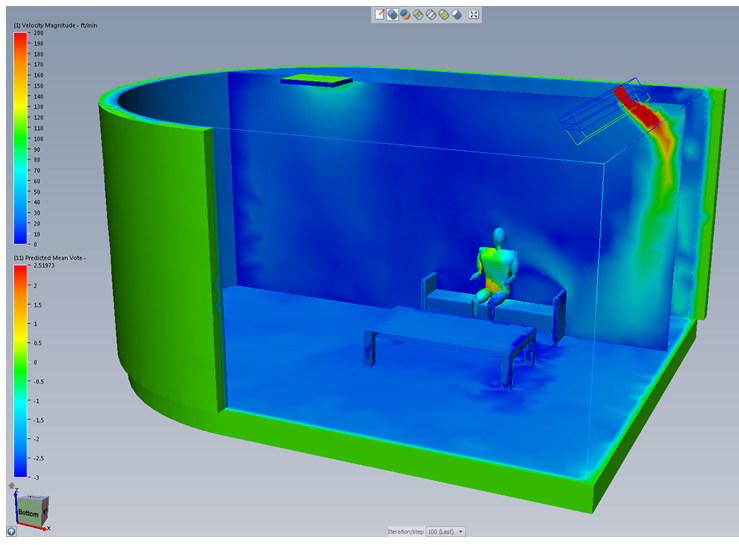
The PMV values indicate that the human occupant is might not be too comfortable--the left arm and leg are really cold!
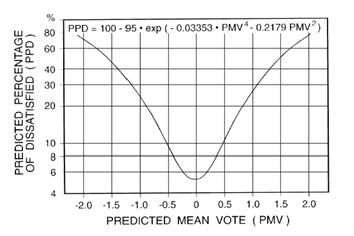
Predicted Percentage of Dissatisfied (PPD)
PPD is an index that establishes a quantitative prediction of the percentage of people that are dissatisfied with the thermal conditions, as determined from PMV. The PPD is highest at the ends of the PMV range:
This image shows the PPD of the same scenario:
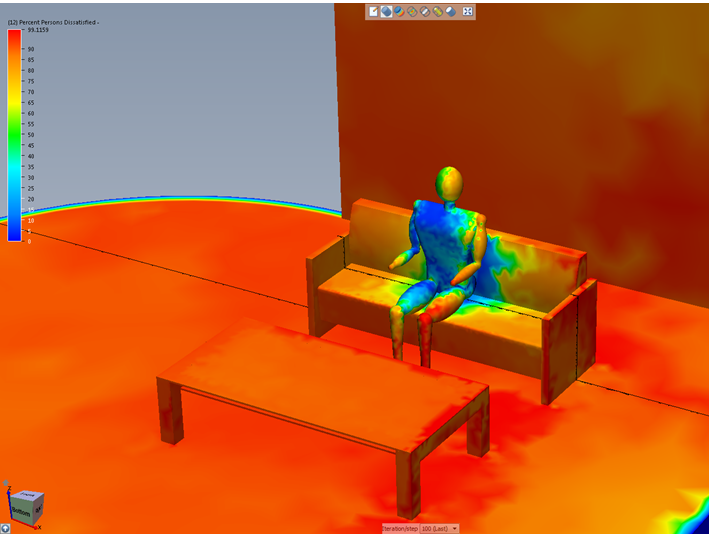
The PPD is highest on the left arm and leg, confirming what the PMV indicated about this occupant.
References
ASHRAE Standard 55-2004
http://www.globalspec.com/reference/13800/121073/chapter-6-4-1-mean-radiant-temperature.
http://en.wikipedia.org/wiki/Mean_radiant_temperature