The maximum temperature at 300 seconds is approximately 101°F. We will view a graph of the temperature of a node on the top of the chip throughout the analysis.
- With the
 Selection
  Shape Point or Rectangle and
  Selection Select Nodes commands active, click a node near the center of the top of the chip.
 - Right-click in the display area and select Graph Value(s). A graph displays.
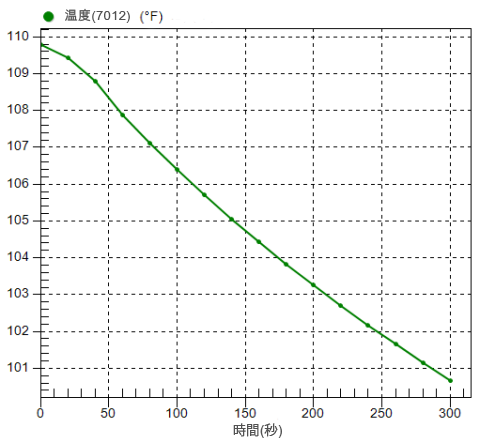
The temperature of the selected node decreases about 9°F during the analysis. The graph varies slightly depending on the node that was selected.
This tutorial is now complete.