Perform an analysis to examine first failure.
As a first attempt at a progressive failure analysis, a through-thickness mesh density of 1 element per facesheet and 1 element for the core, for a total of 3 elements through the thickness of the sandwich construction is used. In this case, the C3D8R (reduced integration element) is used.
Model
ASCA_EP1_1elemFace_1elemCore.inp
- Element type: C3D8R
- Through-thickness mesh density:
- Composite Facesheets: 1 element
- Foam Core: 1 element
Results
The table below displays the load level at which each type of failure event is predicted. The criteria used to predict localized matrix failure and localized fiber failure are described in detail in the Theory Manual. In the table, it should be emphasized that the matrix failure and fiber failure load levels indicate the load at which a localized matrix or fiber failure is first detected. Note that this first instance of matrix failure or fiber failure occurs at a single Gaussian integration point within one of the material plies of one of the elements of the model. In a large composite structure containing thousands (or millions) of Gaussian integration points, a very large number of localized constituent failures are necessary in order to detect any appreciable change in the overall stiffness of the composite structure.
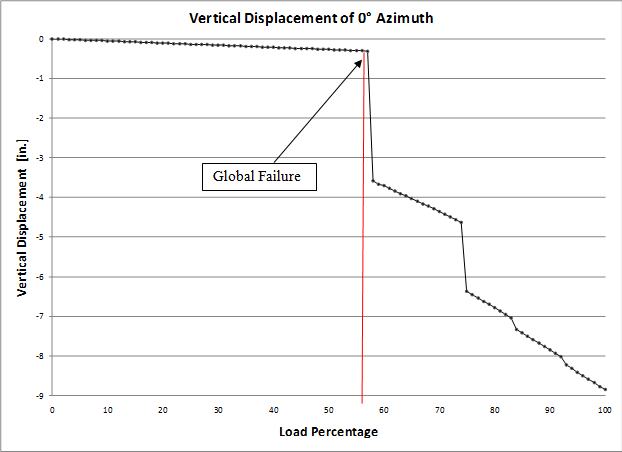
Global structural failure can be defined in many different ways, but for the purpose of this example problem, global failure is defined as a large discontinuity in the composite structure's overall vertical load-displacement curve. The overall vertical deformation of the composite structure is quantified by using the vertical displacement at the load application point labeled 0° in the image in the Problem Description section. Because the load head and adapter are considered rigid, a large discontinuity in the load-displacement curve is indicative of very rapid growth (spreading) of localized material failures that occur during a particular load increment. This results in a large degradation of the overall stiffness of the composite structure.
The plot below shows the overall vertical load-deflection curve for the composite structure. Note that the overall response of the structure appears to be linear up to a load level of 57%, at which time a global structural failure occurs. As seen in the table below, the first localized matrix failure occurred at a load of 49% and the first localized fiber failure occurred at a load of 57%. However, all of the localized failures that occurred between the load range of 49% and 57% were not sufficient to produce a visually detectable change in the composite structure's overall load-deflection response. When the load is increased from 57% to 58%, a very large cascade of localized failures occurs. This failure cascade is significant enough to reduce the vertical stiffness of the composite structure by 92%. This type of behavior, where the overall response of the composite structure remains approximately linear up to global structural failure, is fairly common among structures composed of brittle composite materials.

- Load percentage is on a 0-100% scale
- Global failure is defined as a large discontinuity in the load-vertical displacement curve for the 0° application point of the load head shown previously
This first failure analysis is simply intended to provide a base-level prediction that can be used for comparing the results of subsequent modeling efforts.