Use settings to control the display of survey components during import and entry of survey data.
Note: The interactive graphics are temporary.
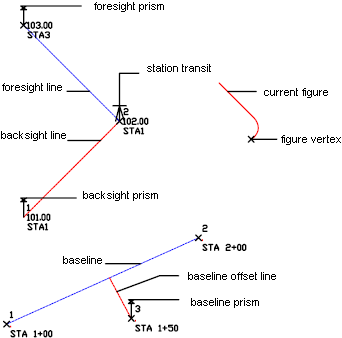
Examples of survey interactive graphics:
- Click

 Find.
Find. - In the Survey User Settings dialog box, expand the Interactive Graphics property group.
- Select the check boxes for the interactive graphics that you want to display.
For descriptions of the interactive graphic components, see Survey User Settings dialog box.
- Optionally, to change the colors for the components, click the color swatch to open the Select Color dialog box, from which you can select a color.
Note: Using interactive graphics when you are importing a field book file significantly slows the import process.