Analyzing Transportation in Factory Layouts
You can analyze product transportation costs using a number of variables. The result will help to optimize your factory asset placement in your layout. You can adjust the analysis variables.
To analyze transportation costs:
- Click Factory tab > Analysis panel > Transportation
 .
. The Material Flow Browser displays the Routings tab with the list of Jobs.
- All jobs are immediately analyzed and the results presented.
- The Transportation and Total Cost indicators display the analysis results. Flags and connection lines provide additional feedback.

Numbered red flags appear next to the stations. The flags indicate Station intensity, a measure of how much material flows through that station. The numbered flags can be used to guide you to the regions where changes can have the greatest impact.
Between the stations are connection lines colored in red or green. Red indicates a high intensity or high material flow path. These can be used as indicators of regions in the network of stations and jobs that can have the greatest impact on the transportation cost.
- To perform a discrete analysis of one or more jobs, right-click the analysis indicator and click Select Job. Then, in the Material Flow Browser select one or more jobs to analyze. After selecting the jobs to analyze, press Enter.
- Reposition the stations, using click and drag, to see modify the impact.
Transportation Indicators
You can adjust the indicator intensity type as well as the information reported on by the indicator.
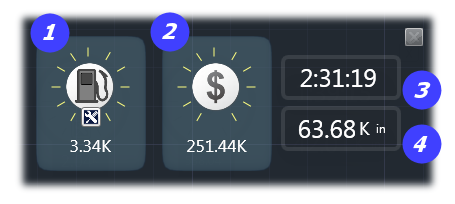
- Transportation Cost = Travel Time x Cost Rate.
- Total Cost = Transportation Cost + Machining Cost.
- Displays the Total Travel Time.
- Displays the Total Travel Distance.
Access the Indicator settings by clicking  in the Transportation Cost indicator.
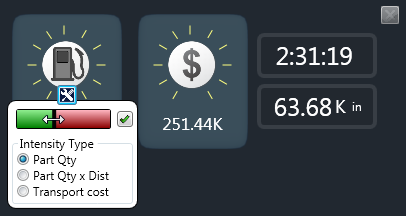
Drag the black separator bar between the red and green fields to modify the sensitivity. Specify the Intensity Type.