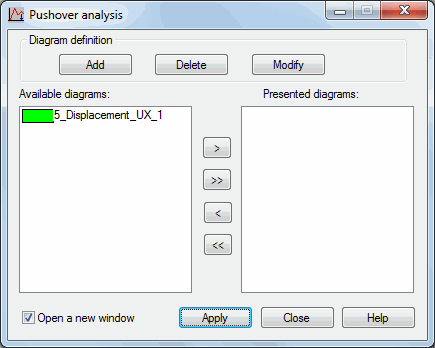
Pushover analysis results can be displayed in diagrams, maps, and structure deformations. They are available for each of the components separately. Clicking Results menu > Advanced > Pushover Analysis, the following displays.

Pushover analysis results are presented as diagrams of a selected quantity in the analysis step (dimensionless time) function.
The dialog in the previous image has the following options:
- In the Diagram definition field:
- Add - Activates the dialog for new diagram definition .
- Modify - Activates the dialog for diagram definition.
- Delete - Deletes the definition of the diagram currently selected on the list.
- At the bottom of the dialog are 2 panels: one showing defined diagrams (Available diagrams) and the other, displaying diagrams selected for display (Presented diagrams). Between these panels are the standard buttons for moving the table contents:
- > - Moves a selected diagram to the right panel.
- >> - Moves all diagrams to the right panel.
- < - Deletes a selected diagram from the right panel.
- << - Deletes all diagrams from the right panel.
- Open a new window - if selected, a view showing diagrams is opened.
After diagrams are defined and moved to the Presented diagrams field in the Pushover analysis dialog, clicking Apply displays a view with the selected diagrams. The diagrams are presented in the same manner as for time history analysis.