A common question in FEA is what mesh size is required to get accurate results. When working with a CAD model, the Global Mesh Refinement command can be used to answer that question. This command accesses the Mesh Study Wizard, which automates the following tasks:
- Meshing the model at different (decreasing) element sizes
- Performing the stress analysis for each global mesh size
- Querying and comparing the results
Set up the model
Before performing the mesh study, you must first perform the following steps:
- Open the CAD model in Autodesk Simulation Mechanical.
- Set the analysis type to Static Stress with Linear Material Models.
- Set any special meshing options such as the type of mesh (solid, midplane, plate/shell), refinement points, mesh matching tolerance, and so on.
- Add surface, edge or part loads and constraints to the model. Nodal loads applied to the CAD parts will not be retained during the study.
- Optionally, mesh the model.
- Define the Element Definitions.
- Define the Material properties.
- Define the Analysis Parameters.
- Optionally, do a Check Model or perform the analysis (Run Simulation).
- Although the model does not need to be meshed before hand, we recommend that you do so to reveal any problems with the model and setup.
- If you are adding refinement points, consider using the Divide factor type instead of the Mesh size type of refinement. In this way, the mesh around the refinement points will always be a factor smaller than the overall mesh size instead of being the same size in all iterations. (See Refinement Points for details.)
- Although it is not necessary to do a Check Model or to perform the analysis, it is recommended that you do so to uncover any problems with the model and setup.
Set up Global Mesh Refinement
Click Analysis  Mesh Convergence Global Mesh Refinement. The Mesh Study Wizard dialog box appears. Press Next to begin the setup.
If a model is already opened and an applicable design scenario is loaded:
The currently loaded design scenario will be used as the basis of the mesh study. Skip to the procedure under the Steps common to all mesh studies heading.
If no model is currently open:
For a blank Simulation Mechanical session, the Mesh Study Wizard will display additional screens where you specify the model and design scenario to use.
Select a model for the mesh study: Press the browse button and navigate to the location of the model. The model must have at least one design scenario with a Static Stress with Linear Material Models analysis type. Press the Open button to load the model. Press the Next button to proceed.
Select the Design Scenario in this model that will be the basis of this mesh study: Design scenarios are listed in the dialog box. Only design scenarios with the Static Stress with Linear Material Models analysis type will be available for selection. Press the Next button to proceed. The remainder of the procedure is given under the Steps common to all mesh studies heading.
Steps common to all mesh studies:
Mesh size parameters: This step is used to set what size meshes to use for the study.
- Specify the type of mesh size control that you want to use in the Type drop-down box. The Percent of automatic and Absolute mesh size options are available. (Refer to the page Model Mesh Settings: Surface for information on these options.)
- Specify the limits of the mesh size in the Start size and End size fields.
- Specify how many analyses will be performed in the Total iterations field. The difference between the start and end mesh sizes will be divided into equal segments using the total iterations value. For example, two iterations would perform the analysis at the start and end size, three iterations would perform one additional analysis with a mesh size half way in between, and so on.
Press the Next button to proceed.
Define the results that will be used as the criteria for the effectiveness of the mesh: This step is used to set what result is recorded for each analysis, and loosely where the result occurs. When the design study finishes, a graph of the result versus the mesh size is displayed.
- Result: Use this drop-down selector to choose one of the following three results options. The mesh comparison will be based on the specified result.
- Displacement
- Strain Tensor
- Stress Tensor
- Type: This drop-down menu further qualifies the result on the mesh comparison is based. The available options depend upon the selection made in the Result field, as follows:
| Table 1: Type Choices for Each Result Option | |
|---|---|
| Result = Displacement | Result = Strain Tensor or Stress Tensor |
|
|
- Result Filter: Filter the results used as the basis of the mesh comparison using one of the following three options:
- Max: Use the maximum (that is, most positive) displacement, stress, or strain result. When compressive (negative) results are present, the most positive (or least negative) result is used. This result may not be the one with the greatest magnitude. Use this option when the critical result values are expected to be positive.
- MaxAbs: Use the maximum of the absolute values of the result (maximum magnitude). This option is advisable when negative and positive result values are expected and you are not sure whether tensile or compressive results will be the most critical.
- Min: Use the minimum (that is, most negative) displacement, stress, or strain result. When tensile (positive) results are present, the most negative (or least positive) result is used. This result may not be the one with the greatest magnitude. Use this option when the critical result values are expected to be negative.
Inquire Maximum Results Summary. This summary is also based on unsmoothed results of all nodes (surface and interior). See the Results Environment page for a discussion of smoothed and unsmoothed results. Run the mesh study
Press the Finish button on the wizard to proceed. When prompted to save your model, choose Yes. The wizard will show the progress of generating the new design scenario, meshing, performing the analysis, and so on. Each step of the process does all of the iterations before starting the next step. That is, all of the new design scenarios are created first (progress bar proceeds from 0 to 100%), then all of the new design scenarios are meshed (progress bar proceeds from 0 to 100%), then all of the new design scenarios are analyzed (progress bar proceeds from 0 to 100%), and so on.
View the results
When the mesh study completes, a graph of the result versus the mesh size will be shown. Right-click in the graph window to perform various graphing functions, such as customizing the layout, saving the graph to an image, and so on. (The graph behaves the same as the graphs in the Results environment. So, if you are familiar with customizing and exporting those graphs, the mesh study graphs are the same.)
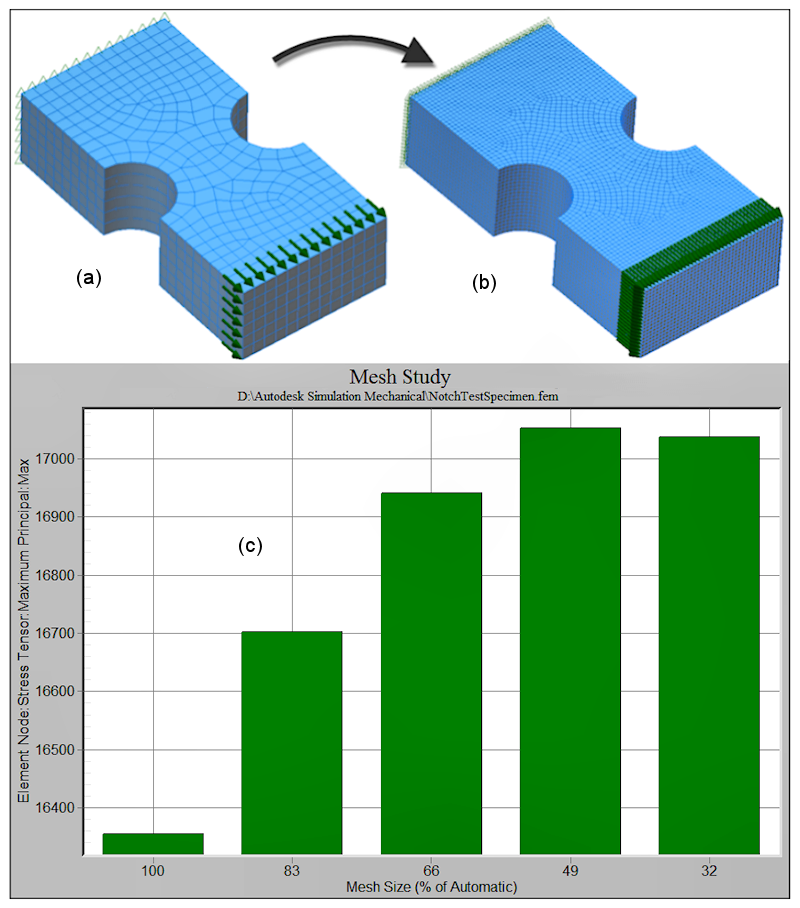
Figure 1: Mesh Iterations and Results Graph
Legend: (a) - First Iteration, (b) - Last Iteration, (c) Results Graph
Also, the results of all iterations are saved in the model as new design scenarios. Open the model in Simulation Mechanical and load the appropriate design scenario to review the input and results.
Redisplay the results graph
Once a mesh study has been performed, and the graph window closed, you can revisit the graph using the following procedure:
- Use your preferred file manager (such as Windows® Explorer) to show the contents of the folder containing the model.
- Open a second file manager window to show the contents of the Autodesk Simulation installation folder (such as C:\Program Files\Autodesk\Autodesk Simulation 20xx).
- Drag the file modelname.msw from the first window and drop it onto the program MeshStudyViewer.exe in the second window.