- Click
 Setup
Setup  Model Setup Parameters.
 - Type 36 in the Number of time steps field and click OK. Results for the 360° crank rotation will be output in 10° increments (360°/36).
- Click
 Analysis Analysis Run Simulation. After solid meshing, the analysis will proceed and the model will be displayed in the Results environment. The displacement magnitude will be presented initially, by default.
 - If the load and constraint symbols are visible, click
 Results Options View Loads and Constraints to hide them.
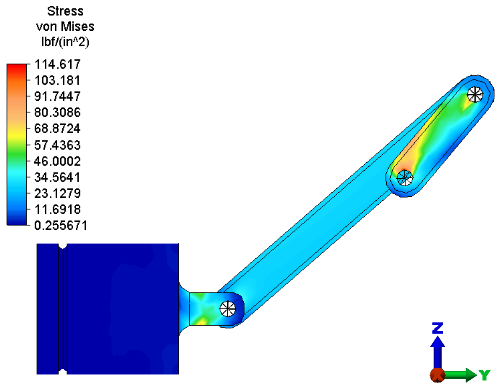
 - Double-click the Stress heading under Saved Presentations in the browser (tree view) to open a von Mises stress presentation.
While the solution is running, the Output Bar will display the analysis log file. You can click on the Convergence Plot tab to see a convergence plot instead of the analysis log. While viewing the Details tab, use the drop-down menu at the right end of the Output Bar to choose between the analysis log and analysis summary files. While viewing the Convergence Plot tab, use the drop-down menus at the right end of the Output Bar to choose the values to plot on the X and Y scales. The analysis window can also be minimized during the solution for a better view of the model.
The analysis can take time depending on your computer resources. An archive with results, Piston Results.ach, is available in your tutorial models folder. Use this file to review the results without having to run the analysis to completion. The von Mises stress results at Time Step 5 are shown below.