During the solution phase, and after the solution has been completed, the Output Bar displays the convergence history within its Convergence Plot tab. The convergence plot is a graphical representation of information listed within the analysis log file. For detailed descriptions of each of these convergence history values, please refer to the Perform Nonlinear Analyses page.
When the convergence plot is displayed, you can use two additional drop-down menu buttons to choose the X-Axis and Y-Axis values to plot. The axis choices do not appear until afterthe solution iterations begin.
The following X-Axis choices are available:
- Time: The instantaneous time within the defined event duration. The values may conform to the capture rate or may be in finer increments (if the time step is automatically reduced due to convergence difficulty, and the user opts to output all time steps).
- Percent: The percentage completion of the defined event, once the currently solving step converges. For example, when the currently solving step is the 12th of a 20-step event, the value is 60% (12/20 = 0.60).
The following Y-Axis choices are available:
- Number of iterations: For each output time step, the number of iterations required to achieve convergence is shown. The number is cumulative and includes all of the iterations (converged and unconverged) since the last output time step.
- Time Step Size: The time increment for the iterations corresponding to output time steps (equal to the DT value from the log). It reflects any time step reduction that is in effect at the time the output step converges. At level 1 (no time step reduction), it is equal to 1 divided by the capture rate. If time increments vary during the solution of any time steps, you must look at the log file to see this data. The log includes data for every iteration (whether converged or not and whether output or not).
- Level: The current solution level, as discussed on the Perform Nonlinear Analyses page. Level 1 represents the originally specified time step size (1/capture rate). Each time the time step is reduced, the level number increases by 1. The level corresponding to the final iteration in a completed time step is plotted. As with the Time Step Size, you must look at the log to see variations in the Level that occur within a time step.
- Residual: The residual norm for each output time step. It is the residual norm for the final iteration in the step. Residual data is not output for unconverged iterations nor for converged iterations that do not correspond to output time steps. However, all residual norms are shown in the log.
You can customize the convergence plot by using the commands found in the context menu that appears when you right-click in the plot area. You can also export the graph (for example, to include an image of it in your analysis report). There are many different commands and options in the first level of the context menu. Customization Dialog and Export Dialog commands lead to dialog boxes with further options. The various graph customization and export settings are fairly self-explanatory and there are various export format options.
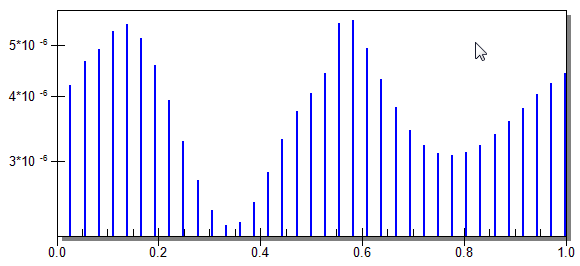
Here is an example of a convergence plot where the X-axis is Time and the Y-axis is Residual. The Plotting Method is Bar, but Point, Line, Spline, and other options are also available: