縦断ビュー内の線形の水平ジオメトリのフィーチャを表示するには、AeccBandHorizontalGeometryStyle 型を使用します。 線形内の接線と曲線はスタイルが設定された線分セグメントと曲線セグメントとして表示され、各セグメントの上にラベルを表示できます。
各ラベル スタイルは、次のプロパティ フィールドを使用できます。
| AeccBandLabelStyle 文字コンポーネントで使用できる有効なプロパティ フィールド |
|---|
| <[Length(Uft|P2|RN|Sn|OF|AP)]> |
| <[Tangent Direction(Udeg|FDMSdSp|MB|P6|RN|DSn|CU|AP|OF)]> |
| <[Start Station(Uft|FS|P2|RN|AP|Sn|TP|B2|EN|W0|OF)]> |
| <[Start Easting(Uft|P4|RN|AP|Sn|OF)]> |
| <[Start Northing(Uft|P4|RN|AP|Sn|OF)]> |
| <[End Station(Uft|FS|P2|RN|AP|Sn|TP|B2|EN|W0|OF)]> |
| <[End Easting(Uft|P4|RN|AP|Sn|OF)]> |
| <[End Northing(Uft|P4|RN|AP|Sn|OF)]> |
次の例は、線形ジオメトリに関する情報をタイトルとともに表示するデータ帯スタイルの作成を示しています。
Dim oBandProfileDataStyle As AeccBandProfileDataStyle
Set oBandProfileDataStyle = oDocument.ProfileViewBandStyles _
  .ProfileDataBandStyles.Add("Horizontal Band")


With oBandHorizontalGeometryStyle
    ' Add displays and labels for alignment tangents.
    .TangentGeometryDisplayStylePlan.Visible = True
    .TangentGeometryDisplayStylePlan.Color = 160 ' blue
    .TangentLabelDisplayStylePlan.Visible = True
    .TangentLabelStyle.TextComponents.Item(0).Contents = _
      "Length = <[Length(Uft|P2|RN|Sn|OF|AP)]>"
    .TangentLabelStyle.TextComponents.Item(0).Color = 120
    .TangentLabelStyle.TextComponents.Item(0). _
      Visibility = True

    ' Add displays and labels for alignment curves.
    .CurveGeometryDisplayStylePlan.Visible = True
    .CurveGeometryDisplayStylePlan.Color = 160 ' blue
    .CurveLabelDisplayStylePlan.Visible = True
    .CurveLabelStyle.TextComponents.Item(0).Contents = _
      "Length = <[Length(Uft|P2|RN|Sn|OF|AP)]>"
    .CurveLabelStyle.TextComponents.Item(0).Color = 120
    .CurveLabelStyle.TextComponents.Item(0). _
      Visibility = True

    ' Add tick marks at each horizontal geometry point,
    ' the location where different segments of the
    ' alignment meet.
    .TickDisplayStylePlan.Color = 10 ' red
    .TickDisplayStylePlan.Visible = True

    ' Modify how the title is displayed.
    .TitleBoxDisplayStylePlan.Color = 10 ' red
    .TitleBoxDisplayStylePlan.Linetype = "DOT"
    .TitleBoxDisplayStylePlan.Visible = True
    .TitleBoxTextDisplayStylePlan.Color = 80 ' green
    .TitleBoxTextDisplayStylePlan.Visible = True
    .TitleStyle.Text = "Alignment Geometry"
    .TitleStyle.TextHeight = 0.0125
    .TitleStyle.TextBoxWidth = 0.21
    ' Hide the rest of the information locations and
    ' graphical displays.
    .SpiralGeometryDisplayStylePlan.Visible = False
    .SpiralLabelDisplayStylePlan.Visible = False
End With
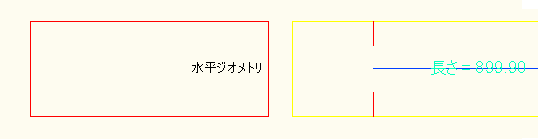
このスタイルは、次のようなデータ帯を生成します。