Examine the two imported models before continuing with results mapping.
Mapping Suitability Plot
Click to ensure the models have adequate refinement in critical areas. The Mapping Sutiability Plot is not supported for un-filled materials.
The mapping suitability plot provides you with an indication of how well the Moldflow results map to the structural model. By combining the knowledge of the Gauss point locations on the structural model with the Moldflow results, we can determine areas of the mesh that could potentially need further refinement.
For example, in locations where the fiber orientations are changing rapidly, a greater structural mesh density may be necessary to capture the changing orientations. In areas where the fiber orientations show little variance, a coarse mesh may be suitable to map fiber orientation tensors. The mapping suitability plot shown below depicts Gauss point locations of the structural mesh. Locations colored in green have enough refinement to capture the variance in fiber orientations. Locations colored in red may need additional refinement.
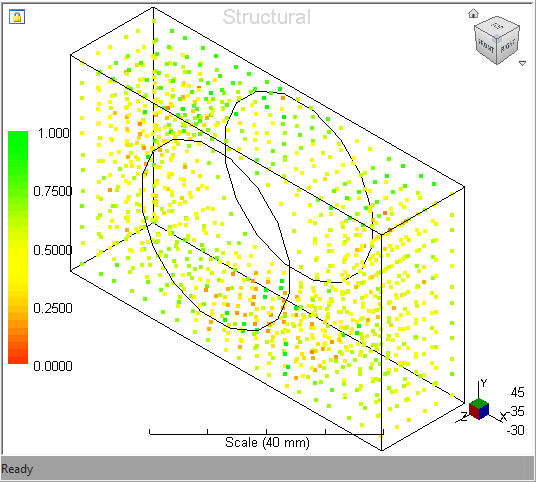
The mapping suitability plot shown above indicates that some of the structure (red) may require additional mesh refinement to accurately map the fiber orientation tensor.
Threshold Plot
When the mapping suitability plot is created, the Threshold Plot tab becomes available.
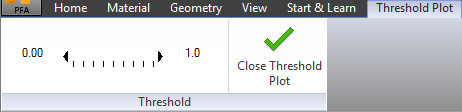
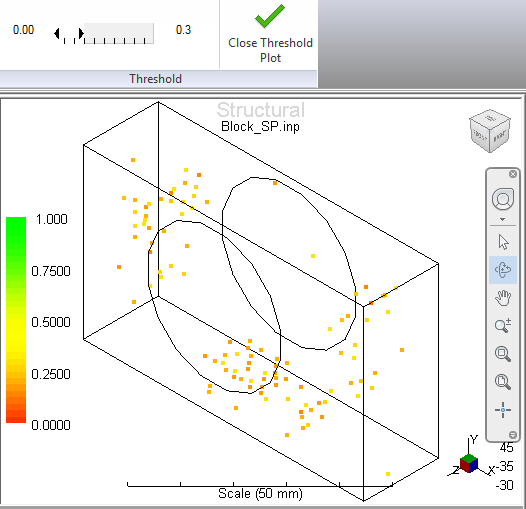
Drag the arrows on the threshold scale to control the range of Gauss points visible in the plot. For example, drag the arrow on the right of the scale to 0.3 to display the Gauss point locations in the model that may need additional refinement.
Click to return to the Home tab. You may also navigate directly to another tab.