The diagram on the facing page shows the process of developing a Web-based application using Infrastructure Map Server. In the diagram, the rectangles represent tasks, the oval shapes represent entities that are created by the tasks or used by them, and the arrows indicate the flow of data. You can break down the development process into five phases (you may also have a Planning and Preparation phase, not included in this diagram):
| On facing page | Detailed steps |
|---|---|
 |
Load file-based data, configure connections to external databases, and extend feature data by joining one feature source to another. |
 |
Build layers that reference, theme, and style the data. |
 |
Create maps by combining layers and other resources, such as watermarks. |
 |
Place the map on the Internet or intranet using layouts for generating web pages and for plotting. Combine with consumer maps such as Google Maps™, Yahoo! Maps, Bing™ Maps, or Open Street Map. Maps, Bing™ Maps, or Open Street Map. |
 |
Develop the web application, using the Infrastructure Map Server APIs to add functionality. |
 |
Test the web application. |
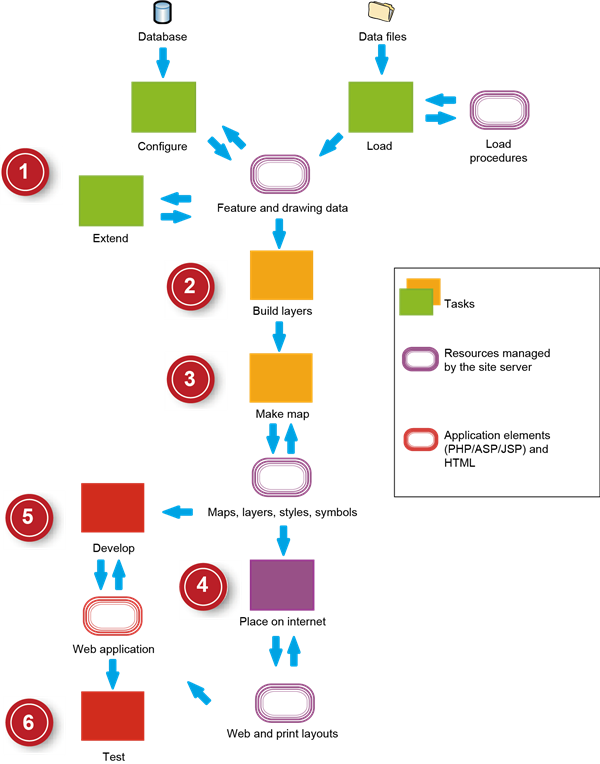
Overview of the development process