The Display options affect how the fluid displays in the scene view. They do not affect the final rendered image.
- Shaded Display
-
Defines which fluid properties display in the fluid container when Maya is in shaded display mode. If Maya is in wireframe mode, the Wireframe Display options apply to the selected property.
Select Off to display nothing in the fluid container when in shaded display mode.
Select As Render to display the fluid as close as possible to the final software render.
Isolating the display of a specific property of the fluid (for example, Fuel) is particularly useful when painting the property with the Paint Fluids Tool or adjusting settings for it. Tweak the Opacity Preview Gain to map the selected property to a useful range of opacity in the grid.
For display options combining Density with another property (for example, Density And Temp), color differentiates the two properties. If the second attribute is not color, then you get a built-in ramp (with blue, red and yellow) that maps the interval 0-1; where there is no density, there is no information about the second attribute.
Select Falloff to display a falloff for Fluid Effects.
- Opacity Preview Gain
-
Adjusts the Opacity of the hardware display when the Shaded Display is not As Render. This is useful when painting values into the grid to help differentiate values that are very close together.
- Slices per Voxel
-
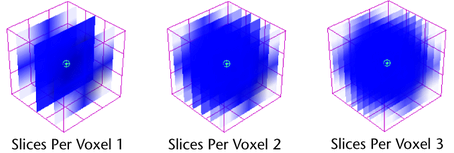
Defines the number of slices displayed per voxel when Maya is in shaded display mode. A slice is a display of values on a single plane. Higher values produce more detail but reduce the speed of the screen draw. The default is 2. The maximum value is 12.

The orientation of the slices is determined by the voxel most aligned with the view plane.

- Voxel Quality
-
If Voxel Quality is set to Better, the display quality is higher in hardware display. If it is set to Faster, the display quality is lower, but the draw is faster.
Boundary Draw
Defines how the fluid container displays in 3D views. The grid corresponds with the Resolution settings.
- Bottom
-
The fluid container displays as a bounding box with a detailed grid on the bottom side. For 2D fluids, this setting displays a detailed grid.
- Reduced
-
The fluid container displays as a bounding box, with a detailed grid on the sides furthest away from the camera. For 2D fluids, this setting displays a detailed grid.
- Outline
-
The fluid container displays as a bounding box, with a detailed grid on all six sides. For 2D fluids, a dotted line displayed around the container indicates the potential volume of the 2D fluid. Note that 2D fluids have thickness, and render as a volume, not as a flat planar surface. To render a fluid as a flat surface, you must map a 2D fluid texture to a plane.
- Full
-
The fluid container displays as a bounding box, with full grid lines representing each voxel. For 2D fluids, this setting displays a detailed grid.
- Bounding box
-
The fluid container displays as a bounding box only.
- None
-
The fluid container does not display, however, any visible properties do display.

- Numeric Display
-
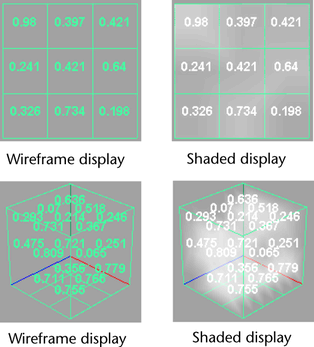
Displays numeric values for the selected property (Density, Temperature, or Fuel) in each voxel of a Static or Dynamic Grid. The numbers that display represent the values before the Scale is applied. For example, if the Density value in a voxel is 0.2 and the DensityScale is 0.5, the number that displays in the voxel is 0.2, not 0.1. No numeric values display when this option is set to Off or when the Contents Method for the selected property is set to Gradient.
Numeric Display can be used in both shaded and wireframe display modes.

Wireframe Display
If the Contents Method is set to Gradient for the property selected for Shaded Display, this option defines how to represent the opacity of the property when Maya is in wireframe display mode.
If Contents Method is set to Static or Dynamic Grid for the property selected for Shaded Display, this option defines how to represent the values of the property when Maya is in wireframe display mode.
- Off
-
Displays nothing in the fluid container.
- Rectangles
-
Displays rectangles on the grid lines of the fluid container. Larger rectangles represent areas with higher values or opacity.
- Particles
-
Displays particles to represent values or opacity. Areas with denser particles represent areas with higher values or opacity.

- Velocity Draw
-
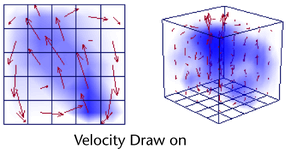
Turn this option on to display velocity vectors for the fluid. Velocity vectors represent the magnitude and direction of the Velocity in the container. Velocity vectors help you visualize the motion path of the fluid.

- Draw Arrowheads
-
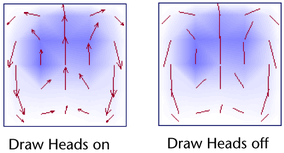
Turn this option on to display arrow heads on the velocity vectors. Turn this option off to speed drawing and reduce visual clutter.

- Velocity Draw Skip
-
Increase this value to reduce the number of velocity arrows that are drawn. If the value is 1 then every other arrow is omitted (or skipped). If it is zero then all arrows are drawn. Increase this number on grids with a high resolutions to reduce visual clutter.
- Draw Length
-
Defines the length of the velocity vectors (a factor applied to the magnitude of the velocity). The larger the value, the longer the velocity segments or arrows. For simulations with very low force, the velocity field might be very small in magnitude. In this case, increasing the value will help to visualize the velocity flow.