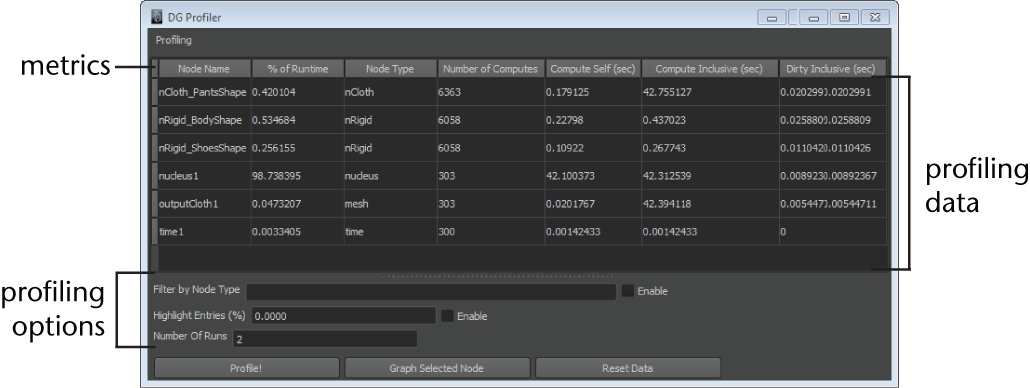
Profiling is a process that computes how much time and resources are used to complete certain processes. It is useful for finding inefficiencies in code that slow down productivity. The DG Profiler is accessed through the API and uses the MFnDependency Node class. It allows you to identify which nodes consume too much processing time, and then reduce unnecessary calls, or otherwise improve process efficiency. Profiling also allows you to filter each node by its specific metrics while working in a scene. The DG Profiler does not measure memory used by data being copied or calculated by the dependency graph (DG).
The DG Profiler generates profiling data for all nodes included in the DG. This tool collects a variety of timing metrics for each node based on the iterations specified. When profiling is complete, the generated data can be exported into a spreadsheet for further analysis. 

To open the DG Profiler:
- Enable the dgProfiler.mll plug in at Windows > Settings/Preferences > Plug-in Manager. Scroll to dgProfiler.mll and ensure that it is loaded.
- Select Windows > General Editors > DG Profiler.
Metrics
- Node Name
- The node's name.
- % of Runtime
- A value that represents the node's compute self time as a percentage of the total time.
- Node Type
- The node type. See Node types.
- Number of Computes
- The number of times the node's compute was executed.
- Compute Self (sec)
- The time required to compute the node itself.
- Compute Inclusive (sec)
- The time required to compute the node plus all dependencies.
- Dirty Inclusive (sec)
- The time required to dirty the attributes of this node and its dependencies.
Profiling options
- Profile!
- Starts the profiling process.
- Filter Nodes
- Filters profiling data by node type. After entering a node type in the Filter by Node Type field, select Enable to filter the data. Deselect Enable to turn node type filtering off.
- Graph Selected Node
- Displays the input and output connections for the selected node in the Hypergraph.
- Save Profile Data
- Allows you to save data from the profiling process. The data is saved in as a Comma Separated Values (.csv) file type.
- Reset Data
- Clears the profiling data from the DG Profiler.