The source current density result is a plot of the current in the actual induction coil itself. It shows the input current that gives rise to the induction heating.
Obtaining this result
 Dual Domain
  3D
3D
- Cool (FEM)
This result does not appear in the Study Tasks pane by default. Instead you can create it as a New Plot, after the analysis has run, by clicking  (). Source current density is listed in the Available results.
Using this result
This plot is a vector plot that shows the direction of the source current, with the length and color of the vector indicating the magnitude. Figure 1 is a result plot on a cutting plane showing an example of the alternating source current density in the induction coil as a result of a 200 amp input current that was cycled through the coil at 10Hz. The alternating source current in the coil gives rise to an alternating magnetic field around the coil.
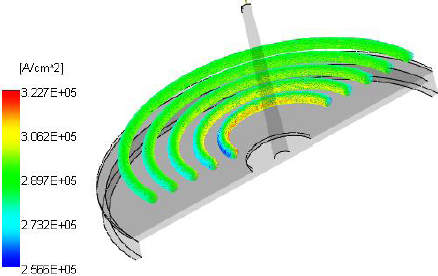
Figure 1: Alternating source current density in the coil
If you set the input boundary condition to current, then the plot shows you the direction of the current in the induction coil. This enables you to verify that the current is following the geometry of the coil, exactly. If you set the boundary condition to voltage potential, then this result shows the resulting current in the induction coil
Things to look for
- The vector plot should follow the geometry of the coil, moving from the high potential to the low potential terminal.
- The magnitude should be more or less the same.
- The vectors in the coil should be aligned.
If your plot does not look as expected, check for a modeling error, or incorrect problem specification.