The magnetic flux density result shows the magnetic field in the mold.
Obtaining this result
 Dual Domain
  3D
3D
- Cool (FEM)
This result does not appear in the Study Tasks pane by default. Instead you can create it as a New Plot, after the analysis has run, by clicking  (). Magnetic flux density is listed in the Available results.
Using this result
Figure 1 shows an example of this vector plot, with the colour showing the strength of the magnetic field, and the vector direction showing the direction in which the magnetic fields in the mold interact with each other. In some cases the magnetic fields in certain regions in the mold can cancel each other out, resulting in very little Joule heating in these regions. The strength of the magnetic field can also be compromised by the material chosen for the inserts. If this is the case, it can be seen in this plot.
The magnetic field should be strongest in the skin depth region, or in a layer very close to the skin of the insert that is in contact with the part. If it is not very high there, then redesign the mold using different materials or different geometry.
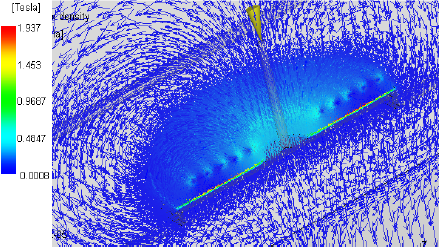
Figure 1: Magnetic flux density results in the mold
Things to look for
- The magnetic field should be orderly and the vectors should follow specific contours in the mold, all indicating the field in the same direction.
- The strength of the magnetic field should show areas of low intensity in the area of the insert. If it does, this could indicate that the magnetic fields are cancelling each other out, or that the metal chosen for the insert is not ideal.
If the plot does not appear orderly, check the model. If the result looks correct, but the strength of the magnetic field is low, consider repositioning the inserts, or changing the insert material.