- The results are automatically loaded into Autodesk Nastran In-CAD.
- Right-click on Results and choose Edit.
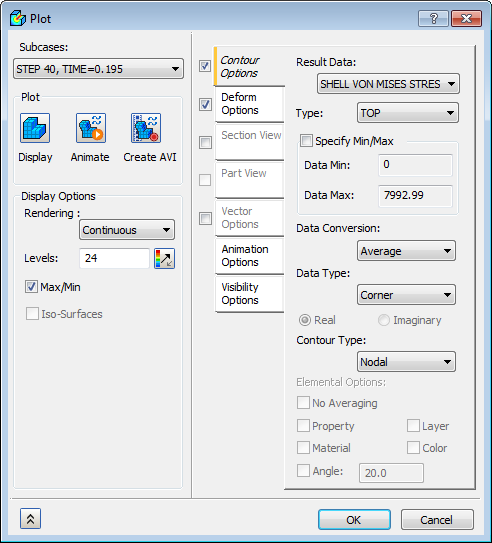
- Select
STEP 40, Time=0.195 in the
Subcases list and make sure the
Deform Options and
Contour Options checkboxes are selected.
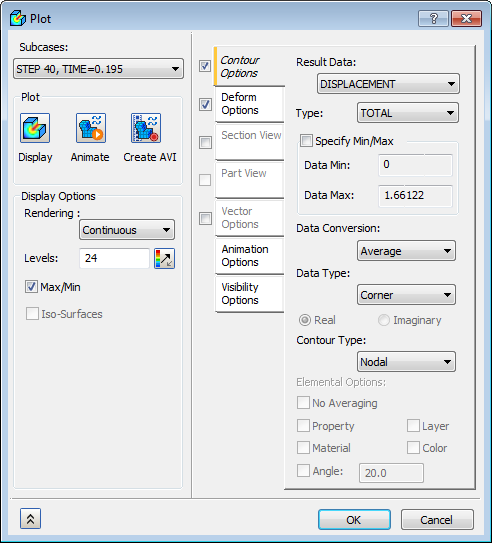
- Select
DISPLACEMENT for
Results Data under
Contour Options. Make sure
Max/Min is checked under
Display Options. Click on
Display under
Plot, and then click
OK to display the results.
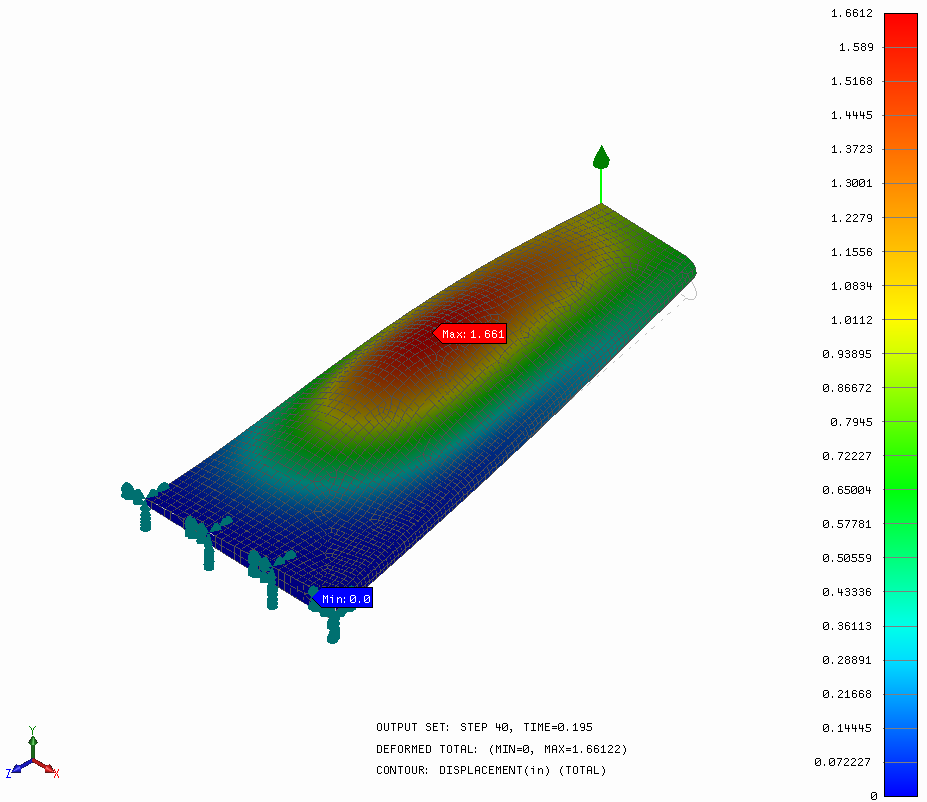
 It may be necessary to edit the
Default Settings,
Display Options to show
Max/Min Data on Contour.
It may be necessary to edit the
Default Settings,
Display Options to show
Max/Min Data on Contour.
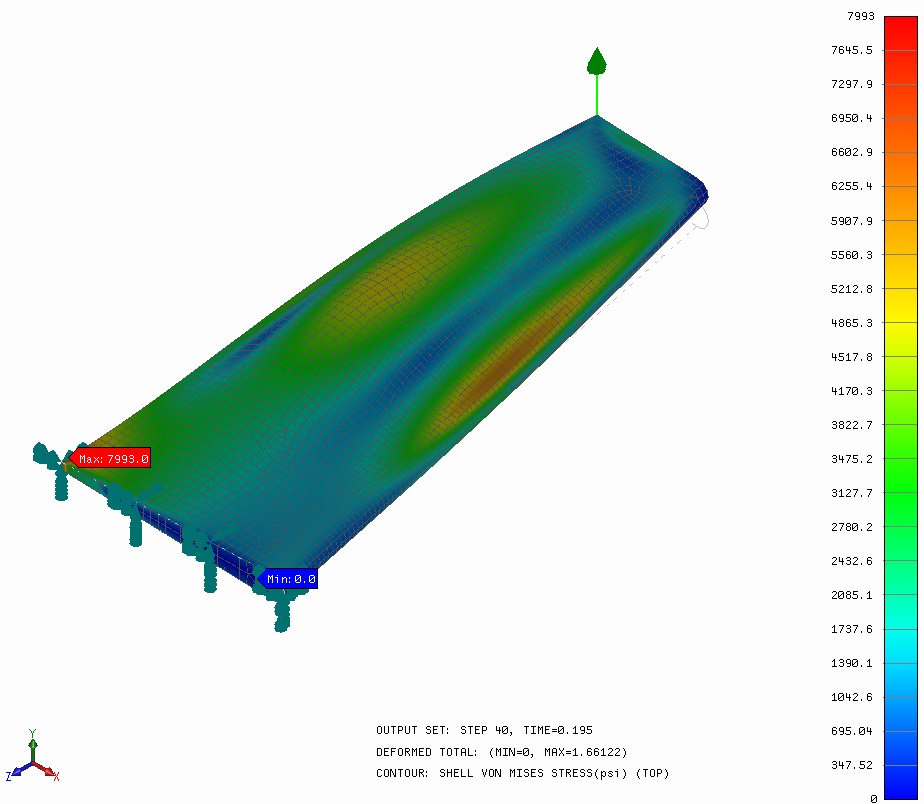
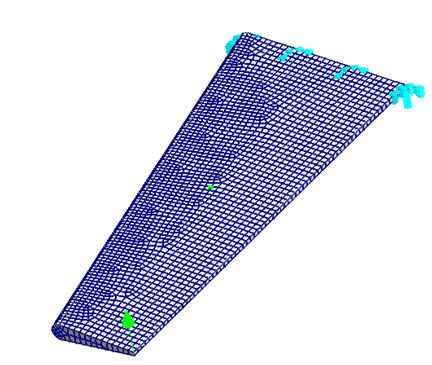
- The results should look like the image below.
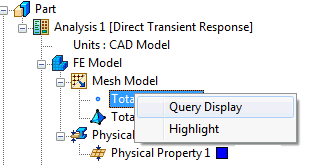
- Right-click on
Total Nodes in the tree and select
Query Display. This will allow you to look at the information on individual nodes by moving your mouse over them.
- Move your mouse so that the node with the load is highlighted. Write down the
Node ID; it will be used later to make an
XY Plot of that particular node’s displacement.
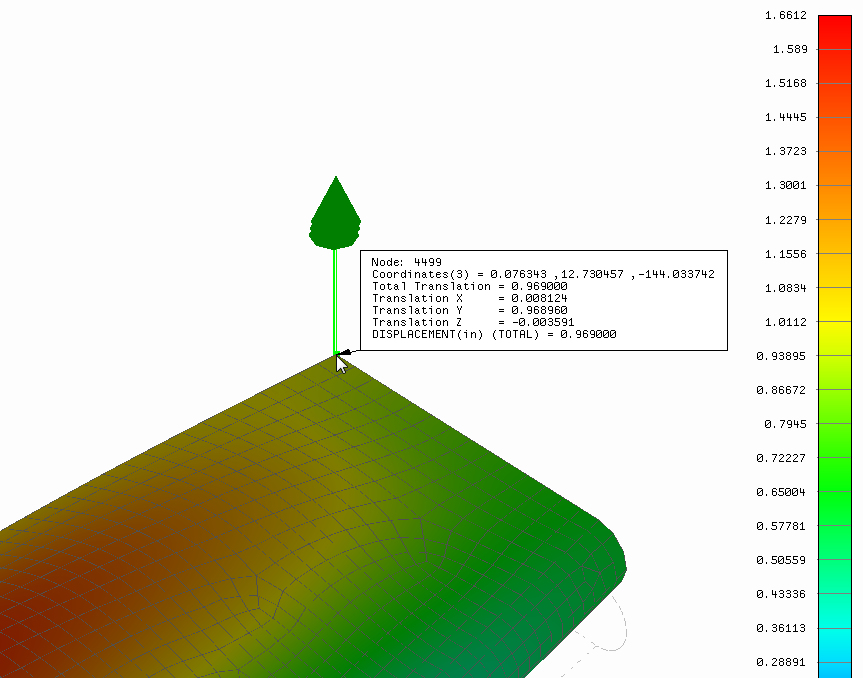 The Node ID might be different from the one shown in this tutorial.
- Right-click on Total Nodes in the tree and select Query Display. This will disable the Query Display.
- Right-click on Results and choose Edit.
- Select
SHELL MAX VON MISES 1/2 for
Results Data under
Contour Options. Click on
Display, and then click
OK to display the results.
- The results should look like the image below.
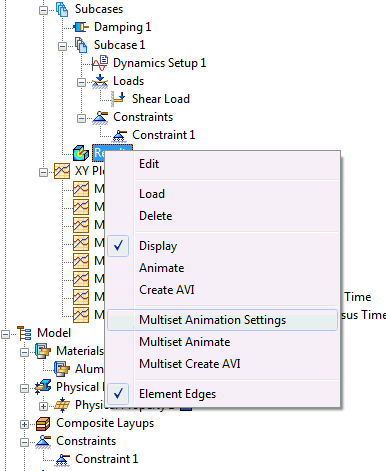
- Right-click on
Results and select
Multiset Animation Settings.
- Change the End Set to STEP 62, TIME=0.305. Check the Deform Options checkbox only, uncheck all the other options.
- Change the
Mode setting to
Half.
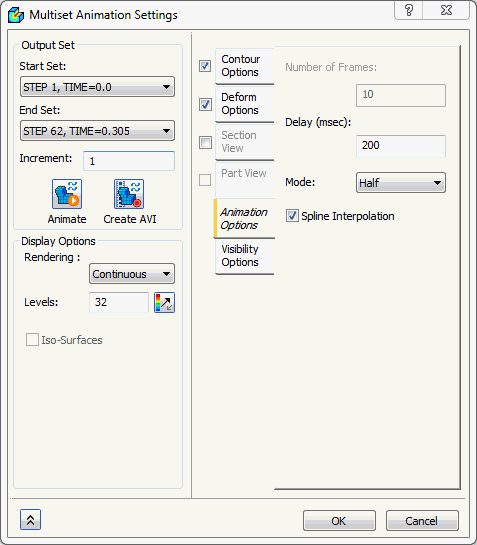
- Click on the Animate button. This will load the animation. Click OK when done looking at the animation.
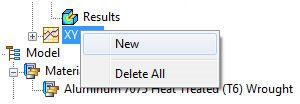
- Right-click on XY Plot and select
New.
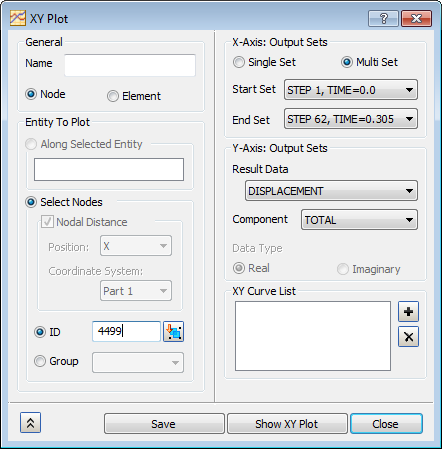
- For the Entity To Plot, make sure Node is selected, and under ID type in the Node ID you previously found.
- For the Output Sets, make sure STEP 1, TIME=0.0 is selected for the Start Set, and STEP 62, TIME=0.305 is selected for the End Set.
- For the Output Vector, make sure DISPLACEMENT is selected for Results Data, and select TOTAL for Component.
- Click on the
Show XY Plot button. The
XY Plot dialog appears.
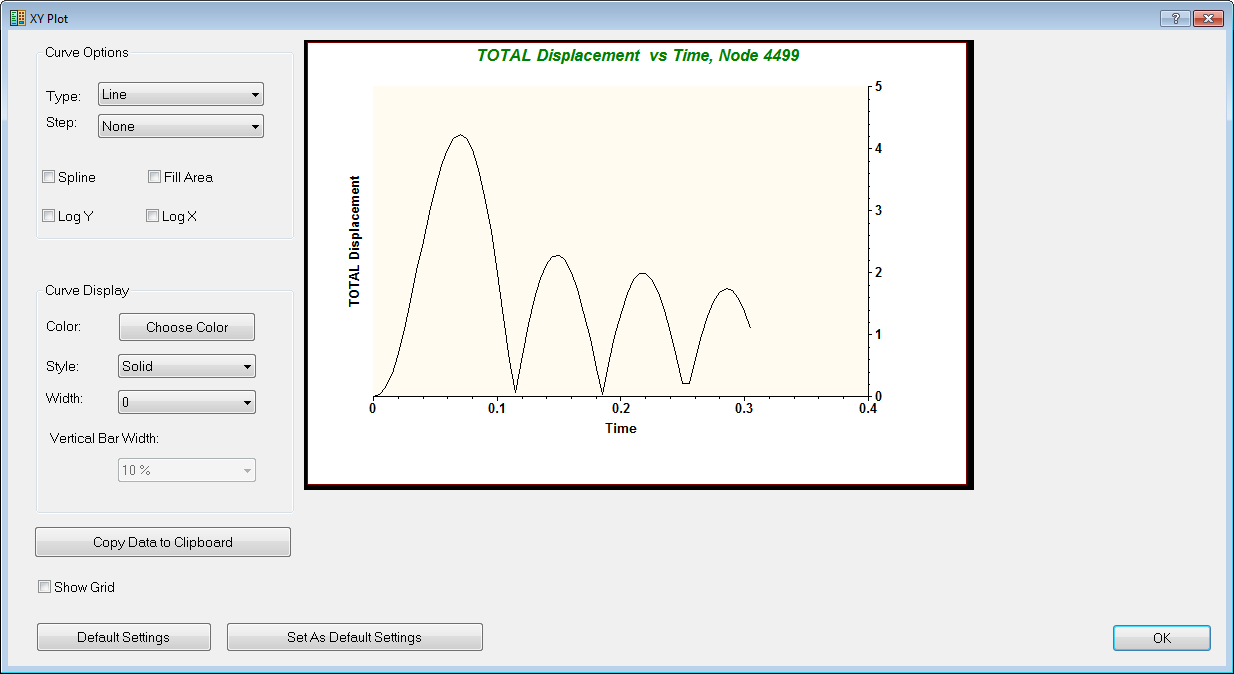
- Click OK on the XY Plot dialog.
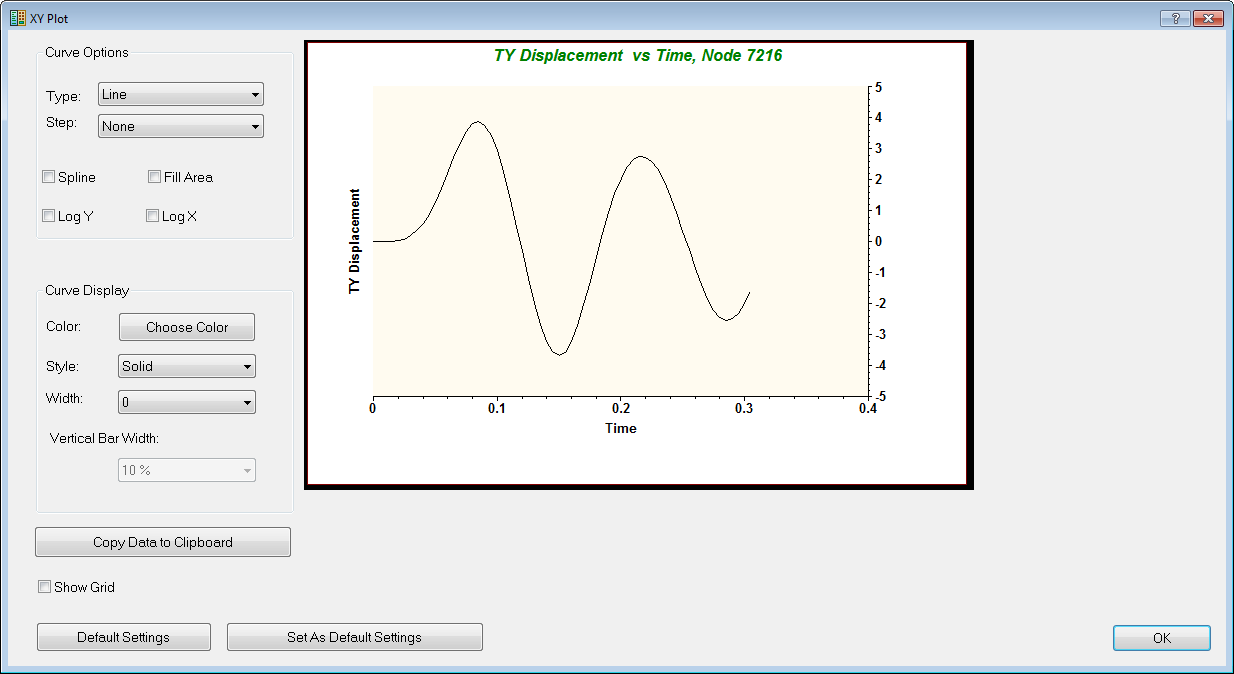
- Now click into the
ID input box field and select a node out in the center span of the wing. A new ID should appear, followed by a green square on the model indicating the node selected.
- Change the Component from TOTAL to TY.
- Click
Show XY Plot.
 Other nodal quantities can be viewed such as acceleration, velocity, and forces.
This concludes Direct Transient Response of a Wing.
The following summarizes the main topics covered:
- Creating tables to be used for transient loading.
- Direct transient analysis setup, including structural damping and time steps.
- Using the nodal query display feature.
- Creating an XY Plot for total displacement.