To setup Dynamics Setup for a Direct or Modal Transient Response analysis, right-click on Dynamics Setup under your Subcase in the tree and select Edit.
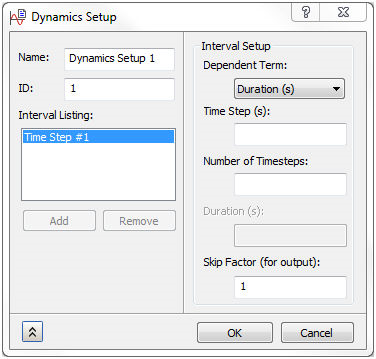
Direct/Nonlinear Transient Response Analysis
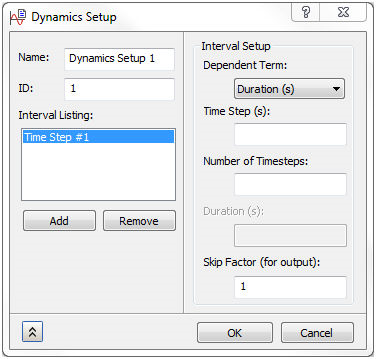
Modal Transient Response Analysis
To setup Dynamics Setup for a Direct or Modal Frequency Response analysis, Random Response or Vibration Fatigue analysis, right-click on Dynamics Setup under your Subcase in the tree and select Edit.
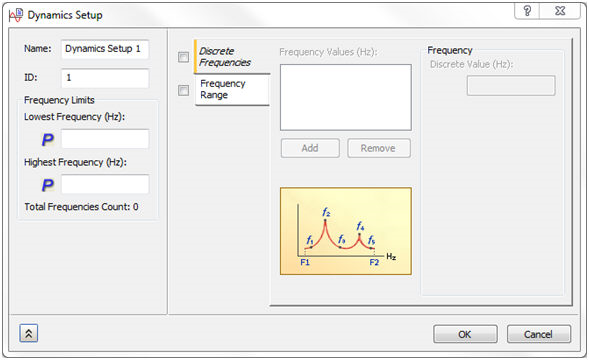
Direct Frequency Response Analysis
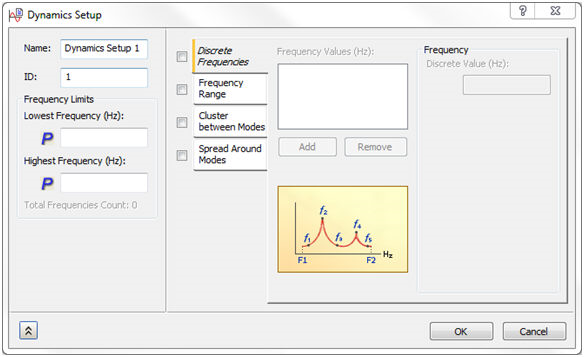
Modal Frequency Response Analysis
Random Response or Vibration Fatigue Analysis
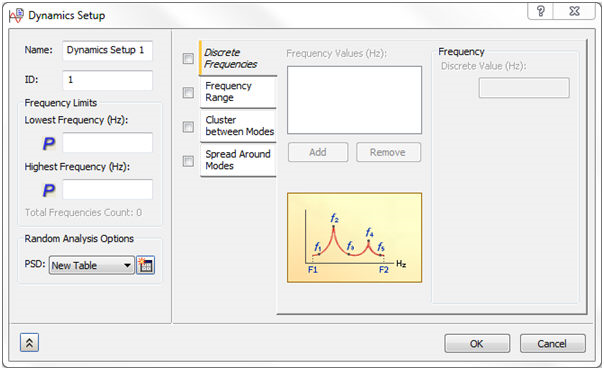
Name: Names the Solution Frequencies defined.
ID: The ID of the property is automatically updated by Autodesk Nastran In-CAD, similar to Materials.
Frequency Limits:
- Lowest Frequency (Hz): This is the lowest frequency in the frequency range of interest for a Direct Frequency Response analysis. This quantity is defined in Hz.
- In a Modal Frequency Response solution Lowest Frequency uses the parameter LFREQ in the Bulk Data file. This cuts off any frequencies below this number. The
 denotes that this is written out as a parameter.
- In a Modal Frequency Response solution Lowest Frequency uses the parameter LFREQ in the Bulk Data file. This cuts off any frequencies below this number. The
- Highest Frequency (Hz): This is the highest frequency in the frequency range of interest for a Direct Frequency Response analysis. This quantity is defined in Hz.
- In a Modal Frequency Response solution Highest Frequency uses the parameter HFREQ in the Bulk Data file. This cuts off any frequencies above this number. The denotes that this is written out as a parameter.
- In a Modal Frequency Response solution Highest Frequency uses the parameter HFREQ in the Bulk Data file. This cuts off any frequencies above this number. The
- Total Frequencies Count: This is the count of total frequencies which is calculated based on lowest and highest frequency with the number of points and frequency increments in the frequency range of interest for a Direct Frequency Response analysis.
Random Analysis Options:
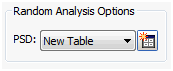
- PSD: It allows you to define Power Spectral Density curve using the Table Data with Data Interpolation options.
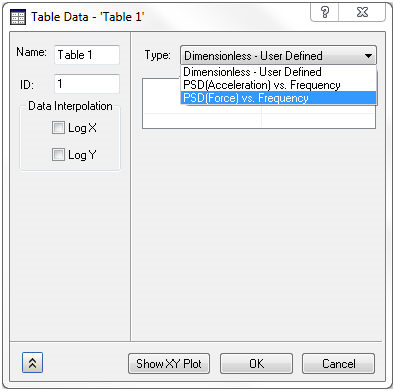
- Type: This allows two options PSD(Acceleration) vs Frequency and PSD(Force) vs Frequency.
- Data Interpolation: It interpolates the Data values entered in the table in logarithmic X and Y direction.
Discrete Frequencies:
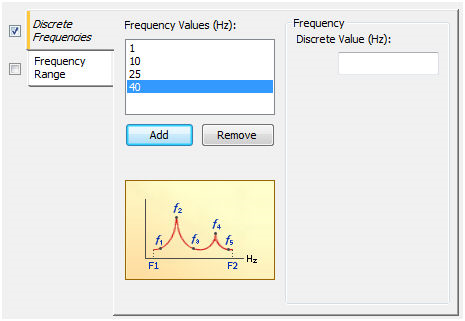
- Frequency Values (Hz): Allows discrete frequencies to be specified by adding them to the list.
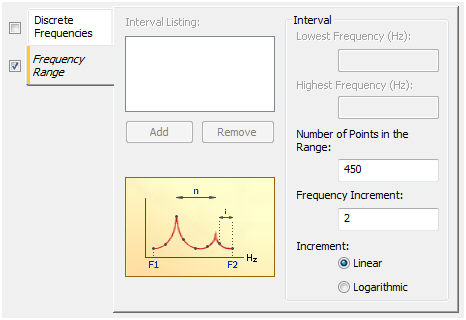
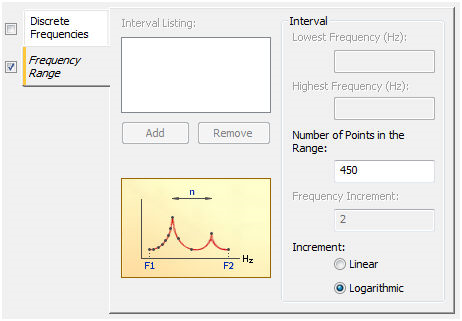
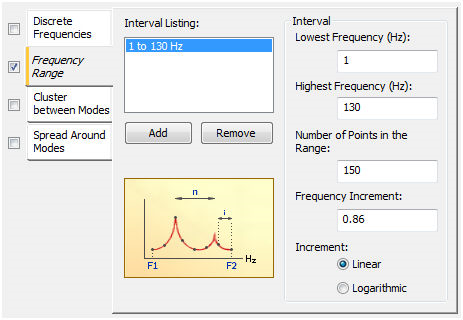
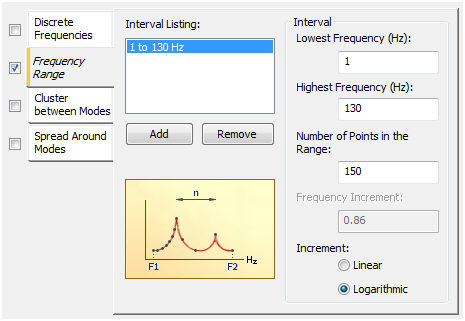
Frequency Range:
Direct Frequency Response (Linear)
Direct Frequency Response (Logarithmic)
Modal Frequency Response (Linear)
Modal Frequency Response (Logarithmic)
-
Linear:
- Number of Points in the Range: Defines the number of frequency points. This value is linked to the lowest and highest frequency range as well as with frequency increment.
- Frequency Increment: Defines the increments between the lowest and highest frequency range. It is linked to the number of points.
-
Logarithmic:
- Number of Points in the Range: Defines the number of logarithmic points within the lowest and highest frequency ranges.
-
Subrange Limits:
- Lowest Frequency (Hz): Defines the lowest frequency for the frequency range of interest.
- Highest Frequency (Hz): Defines the highest frequency for the frequency range of interest.
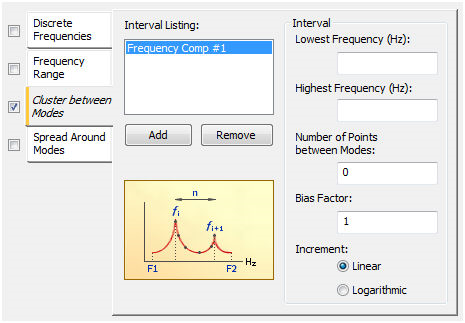
Cluster between Modes:
Linear
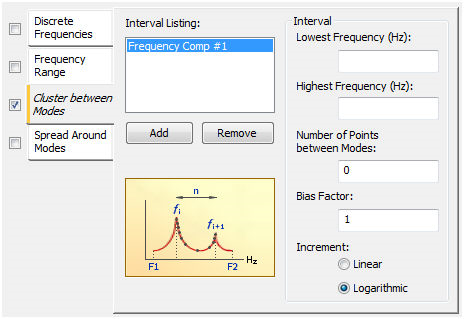
Logarithmic
-
Subrange Limits:
- Lowest Frequency (Hz): Defines the lowest frequency for the frequency range of interest.
- Highest Frequency (Hz): Defines the highest frequency for the frequency range of interest.
- Number of Points between Modes: This defines the number of points between modes.
- Bias Factor: This defines how the points are located. A value of 1 indicates evenly spaced points, and a value greater than 1.0 will bias the points toward the ends of the set and a value less than 1.0 will bias the points toward the center of set. As an example, a set is defined as flowest -> fw1 then fw1 -> fw2 and fwn ->fhighest.
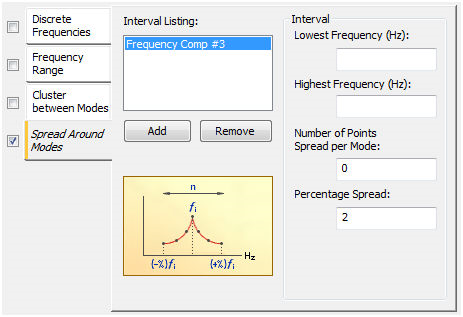
Spread Around Modes:
-
Subrange Limits:
- Lowest Frequency (Hz): Defines the lowest frequency for the frequency range of interest.
- Highest Frequency (Hz): Defines the highest frequency for the frequency range of interest.
- Number of Points Spread per Mode: This defines the number of points within the Percentage Spread around a mode.
- Percentage Spread: Defines a percent of +/- on each side of a natural frequency.