Displays data that can be viewed, modified, exported, and imported.
Find Ribbon: Click Home tab
  Project panel
  Data Manager
  Reports flyout
  Data Manager or Reports.
 Command entry:
datamanager

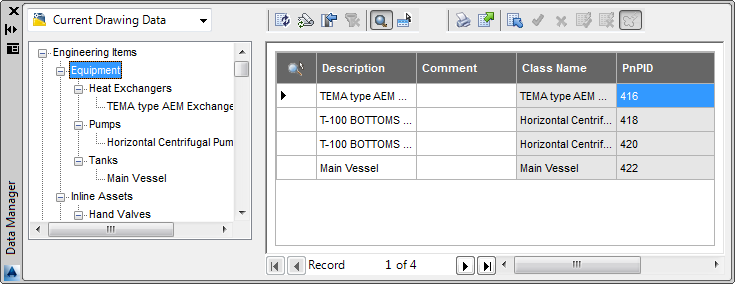
A tree view in the left pane of the Data Manager displays object views, customized views, or reports. The data view in the right pane displays properties for the selected view or report.

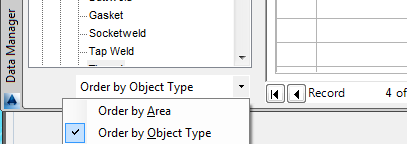
You can change the way the tree is organized, by choosing area or object type.
Shortcut Menu: Tree view
The following options are displayed when you right-click a node in the Data Manager tree view. Different options appear depending on whether you are viewing Project or Drawing Data, Project Reports, or customized views.
| Menu Option | Available For | Description |
|---|---|---|
| Expand/Collapse All |
|
Expands or collapses all nodes in the tree. (This option is dependent upon the current state of the tree view.) |
| Export or Export Data |
|
Opens the Export Data dialog box or the Export Report Data dialog box, where you can export data or reports to a Microsoft® Excel spreadsheet or to comma-separated value (CSV) files. |
| Import or Import Data |
|
Opens the Import From dialog box, where you can import data or reports from a Microsoft Excel spreadsheet or comma-separated value (CSV) files. |
|
Prints the current data view or report. | |
| Remove Filter |
|
Removes all current filters on the tree view. |
| Reset Node Column Order |
|
Restores the default column order in the data view for the selected node on the tree view. |
| Reset All Child Node Column Orders |
|
Restores the default column order in the data view for the selected node on the tree view and the child nodes under it. |
| Show All Nodes |
|
Displays all nodes in the tree, even the nodes for which there is no data in the current project or drawing. |
| Show Only Nodes with Content |
|
Displays only nodes in the tree for which there is data in the current project or drawing. |
| End Current Import |
|
Ends the current import without all changes being accepted or rejected. |
| New Quick Iso |
|
Displays the Create Quick Iso dialog box, where you can create a new isometric drawing. |
| New Production Iso |
|
Displays the Create Production Iso dialog box, where you can create a new isometric drawing. |
| Export to PCF |
|
Exports data to Piping Component Format (PCF) for use in third-party applications. |
Shortcut Menu: Data table
The following options are displayed when you right-click in the Data Manager data table.
| Menu Option | Description |
|---|---|
| Cut | Deletes the contents of the selected fields and places them on the Clipboard. |
| Copy | Copies the contents of the selected fields to the Clipboard. |
| Paste | Pastes field contents from the Clipboard into the selected fields. |
| Zoom | Zooms to the component or line in the drawing that corresponds to the selected row in the data view. |
| Filter by Selection | Shows only items that are selected in the drawing. |
| Filter Excluding Selection | Shows only items that are not selected in the drawing. |
| Filter For: | Allows you to filter items shown in the data table according to certain criteria, such as value ranges. |
| Remove Filter | Removes all current filters on the data table. |
- Data Manager Toolbar
-
Provides buttons that export and import data, accept and reject pending changes, filter or zoom, and so on.
- Drop-down List. Sets the Data Manager view. You can choose drawing data, project data, or project reports. You can also select a customized view, if one is available.
-
 Refresh. Refreshes the tree and data views.
 -
 Synchronize PID Symbols and Annotations. Updates the symbols and annotations with changes made by other designers in project drawings.
 -
 Hide/Show Blank Columns. Hides or shows columns in the data table with no data in them.
 -
 Remove Filter. Removes all current filters on the data table.
 -
 Turn Zoom Toggle On/Off. Turns on or off persistent zoom so that you zoom to any component or line in the drawing when you select its row header in the data table.
 -
 Show Selected/All Items. Turns on or off the filter that shows data only for items you select in the drawing.
 -
 Print. Prints the data view.
 -
 Export. Opens the Export Data dialog box or Export Report Data dialog box, where you choose where to export XLS, XLSX or CSV files.
 -
 Import. Opens the Import From dialog box, where you select the XLS, XLSX, or CSV files to import.
 -
 Accept. Accepts the selected pending change from the import.
 -
 Reject. Rejects the selected pending change from the import.
 -
 Accept All. Accepts all pending changes from the import.
 -
 Reject All. Rejects all pending changes from the import.
 -
 Hide Revision Clouds. Hides or shows the red cloud around those components whose data was modified during import (P&ID only).