The following instructions apply to Visual Studio 2012 Professional. The relevant option is not available in the Visual Studio Express editions.
There are a few differences between debugging a standalone application (EXE) and an external application (DLL) that needs another program to launch it. To debug an application that is using the Autodesk Revit API it needs to be activated by Autodesk Revit. To do this in the developer environment for debugging you will need to:
- Open up the Visual Studio project for the API application. (For example AnalyticalSupportData_Info.csproj from the Samples folder)
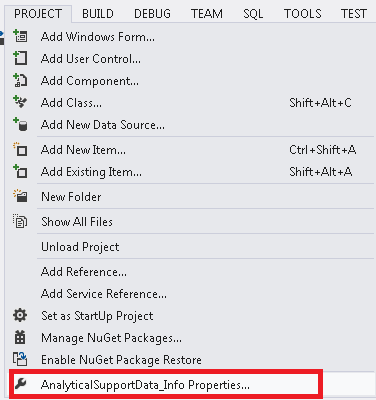
- From the Project menu select AnalyticalSupportData_Info Properties

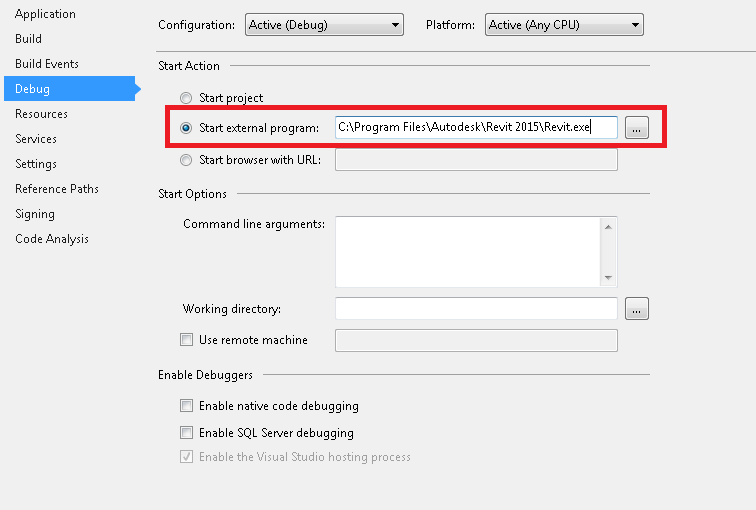
- Select the Debug tab on the left
- Select the "Start external program:" radio button
- Press the browse button and find the Revit.exe file and press Open

- Set some break points in your source code.
- From Visual Studio, select "Start Debugging". Autodesk Revit will launch.
- To hit a break point select the option for your program from the External Tools menu. Once the compiler reaches one of your break points it will stop to let you debug your program.