In this step, we examine the von Mises Stress values on the spring clip.
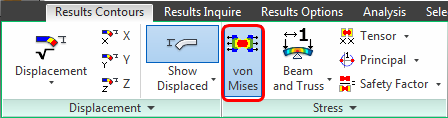
- Click von Mises from the Stress panel to display stress on the assembly.
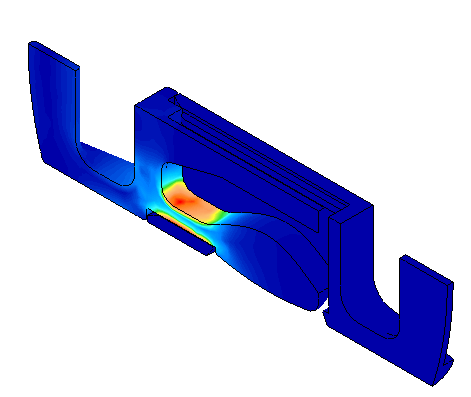
You should see this...
- To locate the Load Case number (time step) of the maximum stress, click Results Inquire
 Inquire (expand the panel to see additional commands) Maximum Results Summary.
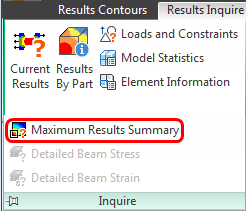
The Inquire: Maximum Results Summary dialog box appears.
- Write down the Load Case number from the top line of the results list, which is when the maximum unsmoothed stress occurs.
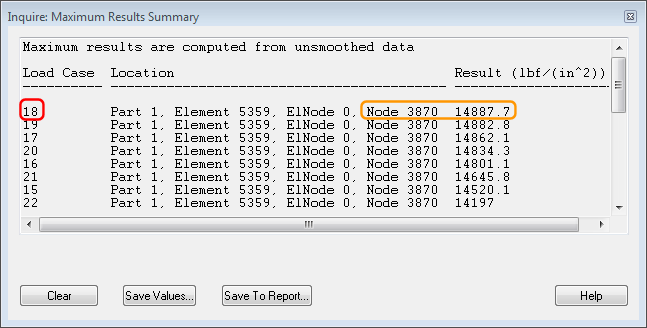 Note: Your results may indicate a different Load Case, Node number, or Result value at this time step. Be sure to record the load case number that you see in your results. The summary includes one line for each load case. The load cases are sorted according to the Result column, in descending order.Important: The values in this summary are based on unsmoothed results. There are multiple calculated results at each node, one for each element that shares the node. The maximum of all of the values at a given node is reported by the Maximum Results Summary. However, by default, the legend and stress contour plot are based on the average of the stresses at each node (this is the default smoothing method). Therefore, the stresses in the summary do not agree with the values in the legend. Also, the maximum stress for unsmoothed results may occur at a different location and time than the maximum smoothed stress. We are using these values only as a way of identifying the approximate time at which peak stresses are encountered. We'll see the smoothed values when we plot the time history of the stress.Tip: There are alternative ways of locating the maximum stress, such as activating the Maximum probe (Results Inquire Probes Maximum). Probes indicate the locations and magnitudes of smoothed results (when smoothing is enabled, which it is by default). However, the probes only show results for the current time step, and only for surface nodes (unless surface elements are hidden).
 - Close the Inquire: Maximum Results Summary dialog box by clicking the X icon in the upper right corner.
- Write down the Load Case number from the top line of the results list, which is when the maximum unsmoothed stress occurs.
-
Go to the Load Case in which the maximum stress occurs:
- Click
 Results Inquire Load Case Options Load Case Set. (Click the down-arrow to the right of the Load Case command to access the Middle, Last Requested, and Set sub-commands.) The following dialog box appears:
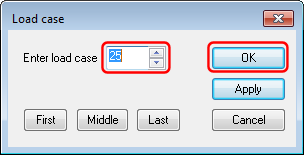
- Type 18 in the Enter load case field. (Substitute the load case number you recorded previously if different.)
- Click OK.
- Click
-
Determine the node number of the maximum stress for this load case:
- Click
 Results Inquire Inquire Results by Part. The following information window appears (widen the window or scroll towards the right to see the Maximum NodeNum column:
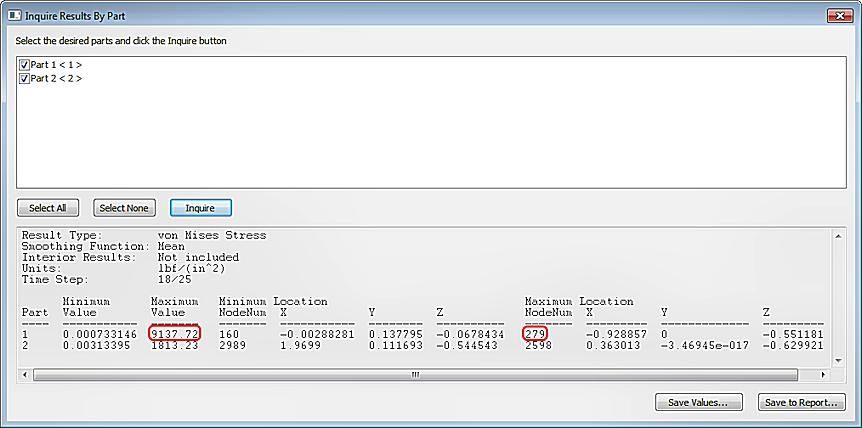
- The Maximum Value occurs in Part 1. Record the Maximum NodeNum (node number) for Part 1. Note: Your results may indicate a different Maximum Value or Node number than shown here. Be sure to record the node number that you see in your results.
- Click
-
Plot the stress at this location:
- Select a node anywhere on the model. It doesn't matter if you don't select the most highly stressed node. We will specify the desired node number while creating the graph. Note: You must select a node before you can access the graphing commands in the context menu.
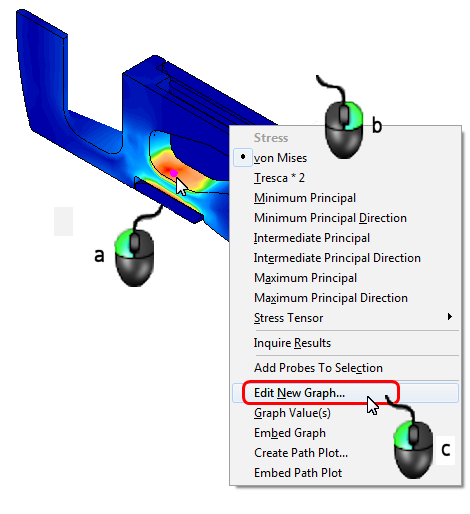
- Right-click anywhere in the display area.
- Select the Edit New Graph command.
- Select a node anywhere on the model. It doesn't matter if you don't select the most highly stressed node. We will specify the desired node number while creating the graph.
- Enter the previously recorded node number (from step 4b) in the Nodes Graphed field and click Apply.
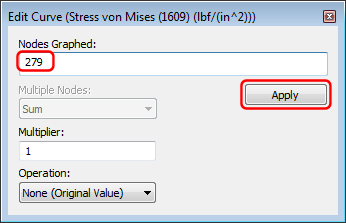
Then, close the Edit Curve dialog box by clicking the X icon in the upper-right corner.
You should see this:
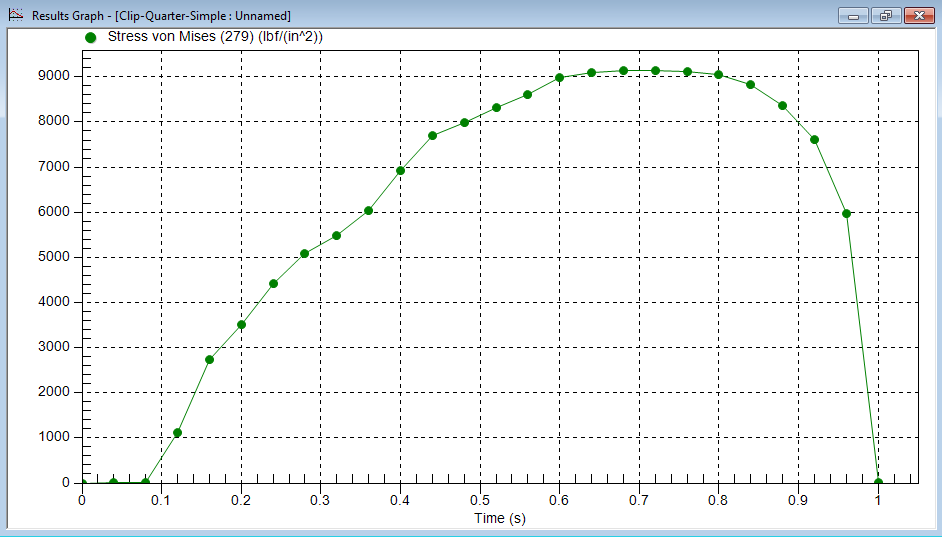
Note the time step at which the maximum stress occurs. In this case, it is time step 18 (0.72 second).
- To close the plot, click the "X" in the upper right corner of the graph window.