The Output File and Options tab is used to specify the file to be created. The new file can either be in the native binary format, or in a text file. When creating a text output file, many options are available for the format.
- New Results File Type section: Select the format of the new results file, the file being written to.
- New Results File button: Click this button to display a standard Windows Save dialog window. Select an existing file, or type the name of a new file to be created. If the new results file already exists, you have the option to over write it, cancel the operation, or append the results to the end (text format only). This button is active only after the Existing Results File has been specified. The name of the currently entered new file is displayed, and a label indicating whether the new results file is being created, overwritten, or appended. If the name is too long to be displayed, hold the mouse over the label, and the tooltip will display the complete name. The new results file name is grayed out after creating the file; to output additional data to the file, click the New Results File button and select the file again.
- Text Output Options section: This frame will appear when the New Results File Type is set to a text file. Use each of the check boxes to indicate what information is to be included in the output text file, as follows:
- Text headers above columns check box: When checked, this option will add labels to the output to identify each column. Adding these make the output easier to read. The header is repeated if the option to add a blank line is also selected. The difference between headers and not can be seen in the following examples. Text headers unchecked: Sample output of a text file with no headers and using a comma to separate the columns. The node number is also included (first column) on each degree of freedom output line (the last six lines in this partial output).
Nodal Results Translator 16.000
Execution date: 11-16-2002 18:58:57
Existing Results File: C:\FEA\static.do
File date: 11/14/02 7:51:00 PM
38,2,0,0,0,0,0,0,0,11,1014503942,10.7
1,0,0,0,0,0,0
2,0,0,0,0,0,0
3,0,0,0,0,0,0
4,0,0,0,0,0,0
5,-5.499E-02,8.528E-02,-1.103,-8.080,-2.518,-10.031
6,-0.102,-8.528E-02,-3.514,8.080,-6.557,-7.985
Text headers checked: Sample output of a text file with headers and using a comma to separate the columns. The load case and node numbers are included on each degree of freedom output line (the last six lines in this partial output).
Nodal Results Translator 16.000
Execution date: 11-16-2002 18:59:07
Existing Results File: C:\FEA\static.do
File date: 11/14/02 7:51:00 PM
# Nodes,# Load Cases,Analysis Code,Direction Code,IDum1,IDum2,..
38,3,0,0,0,0,0,0,0,11,1014503942,10.7
Load case #,Node #,Displ. x,Displ. y,Displ. z,Rot. x,Rot. y,Rot. z
1,1,0.00000,0.00000,0.00000,0.00000,0.00000,0.00000
1,2,0.00000,0.00000,0.00000,0.00000,0.00000,0.00000
1,3,0.00000,0.00000,0.00000,0.00000,0.00000,0.00000
1,4,0.00000,0.00000,0.00000,0.00000,0.00000,0.00000
1,5,-0.05499,0.08529,-1.10309,-8.08047,-2.51857,-10.0310
1,6,-0.10232,-0.08529,-3.51491,8.08047,-6.55785,-7.98501
- Load case numbers on each line check box: When checked, this option will add the load case number to each line with the six degree of freedom values (displacement, velocity, and so on)
For some transient analyses, like Mechanical Event Simulation (MES) and heat transfer, the time corresponding to the load case number is given in a text file (.LTM and .LTT, respectively.) Thus, you can merge these two files together to add the time to your output if appropriate.
- Node numbers on each line check box: When checked, this will add the node number to each line with the six degree of freedom values (displacement, velocity, and so on).
- Add blank line between different load cases check box: When checked, this will add a blank line when the output changes from one load case to another. In the case of using the load case spreadsheet to specify what to translate, a blank line is created when either the load case number changes or after completing the output for a row (taking merged rows into account).
- Group results on single row check box: When unchecked, each line of output contains all selected degree of freedom values (displacement, velocity, and so on) for one node for one load case. When checked, each line of output contains the degree of freedom values for all nodes for one line. This makes it convenient for plotting, summing, or averaging results at particular nodes for all load cases or time steps. (see examples below)
If you are using the load case spreadsheet to specify what to output and you group the results on a single row, the selected header information is printed for each new row of the spreadsheet. This is required because different nodes can be printed for each row of the spreadsheet. If the Nodal Results Translator does not reprint the header, chances are you won't remember what you output.
Think of the binary results file as a spreadsheet with LCxN rows by 6 columns of results (where LC is the number of load cases and N is the number of nodes in the model). When results are ungrouped, the Nodal Results Translator outputs the results in the same fashion: LCxN rows by 6+ columns. (Of course, the number of columns depends on the options selected to output.) When the results are grouped, the Nodal Results Translator output the results into LC rows by Nx6 columns.
One special problem can occur when the results are grouped onto a single row. If you are not careful, you can generate more columns than can be dealt with by other applications. For example, most spreadsheets can handle only 256 columns. Thus, if you try to group the results for a model with 100 nodes and you want the X, Y, and Z displacements, the Nodal Results Translator would generate 300 columns (plus an additional column for the load case number, if so chosen).
If this situation occurs, then you may be able to create separate output files and then merge them in your application. For example, imagine that you want the X displacement at node 45, Y displacement at nodes 34 through 50, and Z rotation at nodes 17 through 28. Since you would currently need to output all 3 results (X displacement, Y displacement, and Z rotation) for all 30 of the nodes (45, 34-50, 17-28), you would end up with 90 columns. If this is too many, then write the one column for X at node 45 to one file, write the 17 columns for Y at nodes 34-50 to a second file, and write the 12 columns for Z at nodes 17-28 to a third file.
The difference between grouped results and ungrouped results can be seen in the following example.
- Text headers above columns check box: When checked, this option will add labels to the output to identify each column. Adding these make the output easier to read. The header is repeated if the option to add a blank line is also selected. The difference between headers and not can be seen in the following examples.
|
|
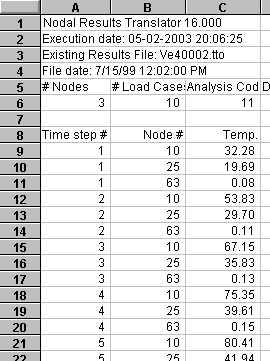
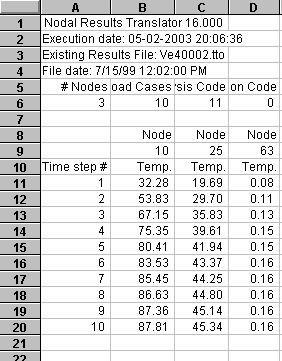
| ''Group results'' unchecked. The selected results (temperature from a transient heat transfer analysis in this sample) are written one node per line, placing all results in one column. (The Nodal Results Translator output shown imported into a spreadsheet.) | ''Group results'' checked. The same set of results is written one time step/load case per line, placing all results in multiple columns. This format is easier to plot and do other manipulations, such as the average result over time. |
- Column Separator drop-down menu:
Use the drop-down list, or type the character(s), to indicate what character or characters are used to separate each value in the output. The predefined column separators are a comma (,), semicolon (;), tab, Return, and space. A Return character puts each output value on a new line; this may not be useful in most cases, and the resulting file could not be read again by the Nodal Results Translator.
Any character that you can type could be used to separate the columns. For example, if the output will be placed in a text report with no further manipulation, you could type | to create a tabular-like output, as follows. (A fixed pitch font, such as Courier, would then be needed in the report to maintain the simple spacing.) Exception: Quotation marks (" ") will not work.
Sample Output With a vertical line character ( | ) as the separator:# | Displ. x | Displ. y | Displ. z | Rot. x | Rot. y | Rot. z 1 | 0.000 | 0.000 | 0.000 | 0.000 | 0.000 | 0.000 2 | 0.000 | 0.000 | 0.000 | 0.000 | 0.000 | 0.000 3 | 0.000 | 0.000 | 0.000 | 0.000 | 0.000 | 0.000 4 | 0.000 | 0.000 | 0.000 | 0.000 | 0.000 | 0.000 5 | -0.055 | 0.085 | -1.103 | -8.080 | -2.519 | -10.031 6 | -0.102 | -0.085 | -3.515 | 8.080 | -6.558 | -7.985 7 | 0.061 | 0.085 | -2.535 | -8.080 | 8.723 | -10.031 8 | 0.754 | -0.085 | -2.083 | 8.080 | 60.611 | -7.985 9 | 0.000 | 0.364 | -2.206 | -17.733 | 10.101 | -20.062 10| -0.163 | -0.364 | -7.030 | 17.733 | 3.819 | -15.970
- Number Format button:
The format of the output numbers (only the six degree of freedom numbers) can be controlled by clicking this button. Doing so will give the following pop-up window:
Specify the format of the text output with the Number Format dialog box. A sample, based on randomly generated numbers, is shown as each option is changed.
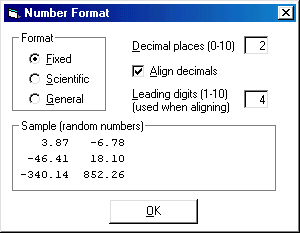
- Format section: Set the format of the output numbers as Fixed (such as 0.02345), Scientific notation (such as 2.345E-02), or General (full precision, such as 0.02345147895).
- Decimal places field: If the number format is set to Fixed or Scientific, then the number of digits that appears after the decimal point is controlled by this entry.
- Align decimals check box: Activate the check mark to adjust the output so that the decimal point (.) aligns in each column. This option generally makes sense only if the output column separator is a space, tab, or user entered character(s). If the column separator is a comma (,), then one is usually going to further modify the output, such as importing it into a spreadsheet. In such situations, the usefulness of aligning the columns is doubtful. When using a tab as the column separator, another option instead of using the Align decimals check box would be to define the tabs as decimal tabs; check the software being used to present the output to determine whether this is possible. (Technically, the numbers are right justified when the Align decimals is activated, so the output would then need to be presented using a fixed pitch font, such as a Courier font.)
- Leading digits field: If Align decimals is activated, it is accomplished by adding spaces to the front of each number, as necessary, so that all values have the same number of characters before the decimal point. Use the Leading digits input to indicate how many characters (spaces or numbers) are needed before the decimal point. If a number requires more digits than specified, then the columns will not be aligned.
- Adjustment Values section:
The Adjustment Values section shows a label and input box for the six degree of freedom values (displacement, velocity, and so on) included in the existing results file. If a degree of freedom is not used in a particular analysis type, the label will read N/A (not applicable). For example, a heat transfer file contains only one degree of freedom: the temperature in the second box. The other 5 boxes are labeled as N/A. Each of the original values can be translated to the New Results File without any modification. Optionally, a user can specify a value to be added to or subtracted from the existing results.
Note: All results and Adjustment Values are in the Model Units. The Nodal Results Translator does not use the Display Units.When the New Results File Type is set to text file, a check box appears in front of each of the six degrees of freedom boxes. Only the degrees of freedom that are checked are written to the new results file; all other columns are ignored and not written to the new results file. Use the Select all columns to output button to activate all check boxes, and use the Unselect all columns to output to clear all check boxes (and then individually select the quantities to output). Note that if you are going to read the text file later with the Nodal Results Translator, all six degree of freedom values must be output, regardless of whether they are a real value or N/A.
Also when the New Results File Type is set to text file, one or two additional results check boxes may appear. These additional check boxes allow the magnitude(s) of the degree of freedom to be output; for example, the total displacement magnitude for a stress analysis. The magnitude calculations take any adjustment values into account regardless of whether the degree of freedom value is output or not.
Note: In a few circumstances when the existing results file is a text format, the analysis type is not uniquely known. Therefore, the labels above the degrees of freedom boxes cannot be accurately assigned. In this case, the label is given as unknown. See the Appendix Analysis Types and Analysis Codes in the DO File for a list of analysis types which are unknown by the analysis code in the header.