When the Report tab is first chosen for the given design scenario, a default report and master report are generated. (The master report includes each of the design scenario reports. The report includes all the data from your model. The default report can be further customized to suit specific requirements, such as rearranging the sections, changing the style, adding custom text and images, and so on.
- The units for the values in the report are set in the FEA Editor or Results environments. whichever Unit System is active when the report is generated or refreshed is used for the values in the report. See the page Selecting a Units System for details on activating different unit systems.
- If the Unit System is changed after adding user-generated sections to the report, the units in these sections will not be converted. For example, if you save, in English inch units, stress contour images or textual results (using the Results Inquire
 Inquire Current Results command), these items will remain in English inch units. To change the units, you must recapture such images or text, and add them to the report again.
Spell checking is built into the report configuration utility. See the Spell Checker page for more information.
The report can be sent to others for review as either a web page (HTML format, viewable with Internet Explorer 5 or greater and other compatible browsers), Portable Document Format (.PDF), Word document (.DOC), or Rich Text Format (.RTF).
Before creating the report, create any images (bitmaps, jpegs, animations) that you will want to include in the report. Also, if you have made any changes in the FEA Editor that do not affect the analysis, such as names of loads or parts, be sure to save the model so that these changes will be read into the report from the database.
Automatic Sections of Reports
The following sections of the report are generated automatically whenever the report is initially created or refreshed. If these satisfy your needs, you do not need to go any further!
- Title Image defaults to the view from the FEA Editor. It can be replaced with a user-generated image by customizing the report with the Configure Report dialog. (To revert to the default image, which updates to the current view from the FEA Editor whenever the report is regenerated, use the Configure Report dialog box and browse for the file modelnameTITLE.PNG located in the design scenario folder.)
- Model Information are the various sections that include the user input, such as the Analysis Parameters, element types, element definition, material properties, and so forth.
- Results Presentations refer to the windows that are opened in the Results environment when the report is generated. If the window is closed, that image will not be included in the report.
- Processor Log Files are the various text files created by the processors during the analysis.
- Code Checking reports can be created in the Results environment. See the page Beam Code Checking for details.
- Saved text results are user-created text files of selected results. These are created in the Results environment with Results Inquire Inquire Current Results Save To Report or Results Inquire Inquire Maximum Results Summary Save To Report. The name of the section in the report is the same as the filename specified when the file was created. By default, these sections are updated with the current text in the saved files whenever the report is generated. Thus, if you update the file and then regenerate the report, the data is updated automatically. If the option Update From File in the Configure Report dialog is deactivated (unchecked), or if the original text file no longer exists, then you can make changes to the text in the Configure Report dialog (such as adding additional text, changing the font, and so on), and the section will not be overwritten when the report is generated. Note: The user-created text files themselves are not updated automatically. You must update the text file as warranted. For example, if the displacement results are saved to the report for an analysis, and then the load is changed and the analysis is re-analyzed, replace the original text file with the new results to have the correct information in the report.Tip: Any text file with an extension of .out located in the design scenario's ds_inquired_results folder will be included in the report.
For most of these sections, the only option is to include the section or not, or to re-arrange the order of the sections. Some of the sections can be customized as described below.
Customize Reports
Both the Master report and the individual design scenario reports are customized in a similar fashion. View the report to change, and then use Report Setup Configure. This accesses the Configure Report dialog. (See Figure 1)
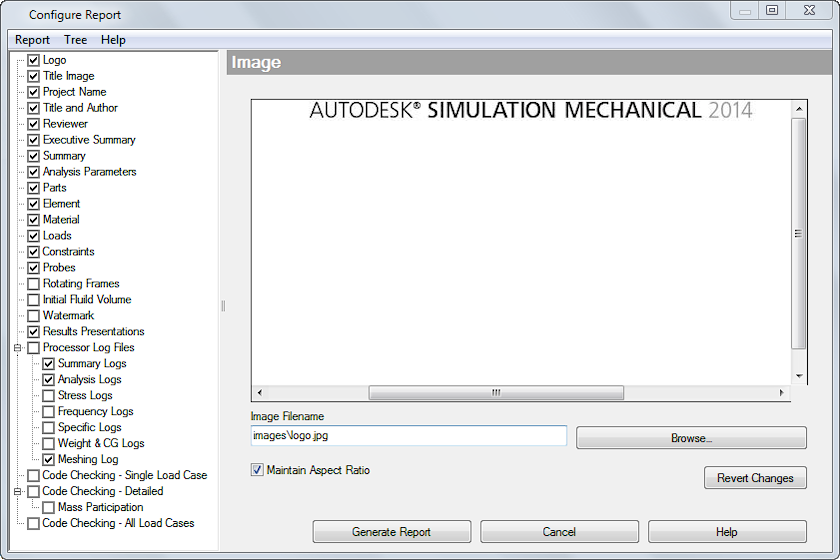
Figure 1: The Configure Report Dialog Box
Using an Existing Report as a Template: If you have saved a report template previously (see below), you can apply that template to the current report. Use the Report pull-down menu and choose Use Report Template. Select the template to use from the list of Saved Templates. (The contents of each saved template is shown as a reminder of what it contains.) Click the Select Template button to replace the current report with the selected report template. all the customization in the report template, including arrangement of the sections, images, user-entered text, and so on, will be placed into the current report. (The text that is generated automatically, such as the Analysis Parameters and Load, will be updated based on the current model, not based on the report template.)
After the template is loaded into the current report, additional customization can be performed just like any report. See the descriptions below.
 Options Reporting tab to set the template as a default. Every report created will start with the default template. See the next page Customize Reports for details.
 If a report template has not been saved, but you want to use a report in a different model as the template for the current model, then use the Report pull-down menu and choose Import format from another model. This will use the report configuration from a different model as a template for the current report.
Activating the Import format from another model command gives a standard Windows file open dialog. Select the model to use as the report template. When the file is selected and the Open button is clicked, the Select design scenario dialog will appear with a list of all design scenarios with a report in the chosen model. Choose which report to import.
As with reading a saved report template (described above), this will replace the current report with the selected report template. all the customization in the report template, including arrangement of the sections, images, user-entered text, and so on, will be placed into the current report. (The text that is generated automatically, such as the Analysis Parameters and Load, will be updated based on the current model, not based on the report template.)
Choose Sections To Include in the Report: Each section of the report is listed in the browser (region 1 in Figure 1). Activate or deactivate the check box to include or remove the section from the report.
Customize Each Section: When a report section is chosen in the browser, the customization options are shown in the display area (region 2 in Figure 1). For example, image sections let you browse for a new image and stretch the size of the image. Text sections display a text editor where you can enter custom text, change the font, color, and other attributes. Message sections are created automatically based on the model's input and cannot be changed in the Configure Report dialog, but they can be re-ordered. (The message sections can be customized by using a custom CSS file. See the next page, Customize Reports, for details.)
Re-Order the Sections: Each section of the report can be moved to a new location in the browser. Use the left mouse button to drag the highlighted item to a new location.
Add New Sections: To add a new section to the report, right-click in the browser and choose one of the following types:
- Add Text - add custom text and graphics (Insert: Image). The Header Text follows the same predefined pattern as other headers throughout the report, such as Reviewer, Loads, Constraints, and so on. The text uses the built-in text editor to format the text as appropriate. The default name for the browser and Header Text are entered when the Add Text command is started.
- Add AVI File - add a standard Windows animation file.
- Add WRL (VRML) File - add a Virtual Reality Markup Language file so the reader can view the model in 3D. The VRML file can be viewed in most standard web browsers (or may need a plug-in).
- Add HSF File - add a HOOPS Stream file (.hsf) created from the Results environment. You will need to download a free HSF viewer to view these files in a web browser.
- Add Image File - add custom images to the report, with a line of Header Text that appears before the image and Caption text that appear after the image. The Header Text follows the same predefined pattern as other headers throughout the report, such as Reviewer, Loads, Constraints, and so on. The Caption text uses the built-in text editor to format the text as appropriate. The differences between the Add Image File section and the Add Text are as follows:
- Multiple images can be added to each Add Text section. Only one image can be added to each Add Image File section. (Multiple files can be selected with the Add Image File; see Tip below.)
- When the report is generated, the images from the Add Text sections are embedded into the report as a static image. The image in the report is the same resolution as in the Configure Report dialog. In contrast, the images from the Add Image File sections are embedded into the report as thumbnails that link to the full resolution image. (See Tip below regarding the formatting of the image size.)
- Add Page Break - add a page break to the report. This only affects printouts of the HTML report. Page breaks have no effect on reports saved to PDF or Word (.doc). (Page breaks added in a Text and Graphics window do not work.)
- Images, animations, and 3-D visualization files added to the report are copied from the original location (selected by the user while browsing for the image) to the report folder (see Saving the Report), but the location of the original image is remembered. If the original image file is modified (such as creating a different image but using the same filename), the modified original image will be copied to the report folder when the report is regenerated or refreshed.
- If the original file is moved or deleted, the link from the copied image to the original is broken, and the report will use the copied imaged that appears in the report folder. Therefore, the copied image needs to be modified in order to make any changes to the report. (Naturally, the "Configure Report" dialog can be use to select a different image.)
- Naturally, images do not update automatically if the model is changed and re-analyzed. The user needs to update the images if the results change. Consider using the automatic "Results Presentations" feature to include updated images of the results. See "Automatic Sections of the Report" above.
Save Report Templates
If the style of a report is useful as a template for other reports, it can be saved to a list of report templates. Everything in the report, including any custom text, added images, which sections to include or not include, and the order of the sections, is saved in the template.
To create a report template, do the following:
- View the report and use Report Setup Configure. This accesses the Configure Report dialog. (See Figure 1)
- Make any changes to the report layout. Include changes that you want to appear in every report that uses the template. For example, change the company logo since this is useful for every report, but do not include images of results since the results are specific to only one report.
- Use the Report pull-down menu and choose Save as Report Template.
- With either the entry Enter Name selected or with no entries selected in the Saved Templates list, enter a name for the report in the Save Template Name field.
- Click the Save Template button.
Options Reporting tab.