- Select
 View
View Navigate Orientation Isometric View.
 - Select
 Analysis Analysis Run Simulation.
 The analysis proceeds and the model displays in the Results environment.
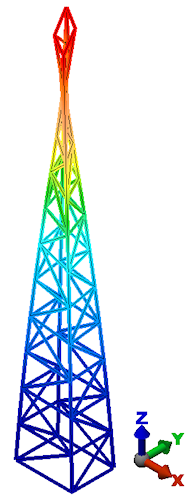
Important: The displacement results shown for a modal analysis are solely for the purpose of demonstrating the shapes of the vibration modes. They are not scaled to any specific structural excitation or load. Therefore, the absolute displacement values are not meaningful.Note: If your model displays different colors than those shown in the image below – for example just green and red – you need to activate the Normalized Displacement results (Results Contours Normalized Displacement Displacement). In addition, if you do not see the shape shown below, your computer could be displaying the vibration mode 180 degrees out of phase from this point in the vibration cycle. To visualize the full vibration cycle, do the following: - Click
 Results Contours Captures Start, and you should see the structure go through the pictured shape during the vibration cycle.
 - Click
 Results Contours Captures Stop when you are finished examining the vibration mode.
- Click