Note: The Results environment shows eight load cases in the annotation at the lower-left corner of the display canvas. These load cases are the three specified frequencies and the five natural frequencies, sorted into ascending order. For each frequency, you can use the options under  Results Options
 Analysis Specific Response Type to view the In-Phase, Out-of-Phase, or SRSS (square root of the sum of the squares) results.
Results Options Analysis Specific Response Type to view the In-Phase, Out-of-Phase, or SRSS (square root of the sum of the squares) results. Now, we view the axial stress results.
- Select
 Results Contours Stress Beam and Truss Axial Stress. The model displays the in-phase results of the first frequency, where the axial stress varies between approximately +/- 1,351 psi.
 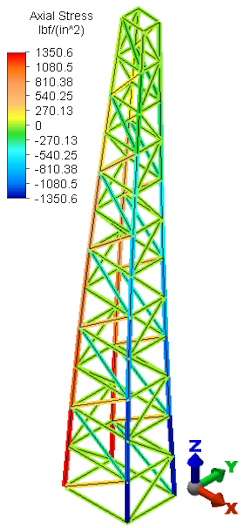 Note: The axial and worst stress values are equal, since trusses only support axial loads. That is, there are no bending stress components.
 - Use the
 Results Contours Load Case Options Next command to view the remaining six load cases.
 The following table lists the first five natural frequencies for the truss model:
Load Case Axial Stress (psi) 1 +/- 1,351 2 +/- 1,993 3 +/- 3.8 4 +/- 3,376 5 +/- 463 6 +/- 137 7 +/- 100
This tutorial is now complete.
Continue to the Truss Tower Transient Stress Analysis tutorial.