Compute the strength of the laminate in five fundamental modes of laminate loading.
Determine the axial tensile and compressive strengths, transverse tensile and compressive strengths, and the in-plane shear strength using the First Ply Failure Survey feature. To perform a First Ply Failure Survey analysis of a laminate, select the First Ply Failure Survey option from the Laminate drop-down menu. This opens the First Ply Failure Survey window which contains two tabs corresponding to the two steps needed to perform the analysis. These two steps are described below.
- Define the Laminate - Use the Laminate tab as discussed previously to create a new laminate or import an existing laminate from the material database.
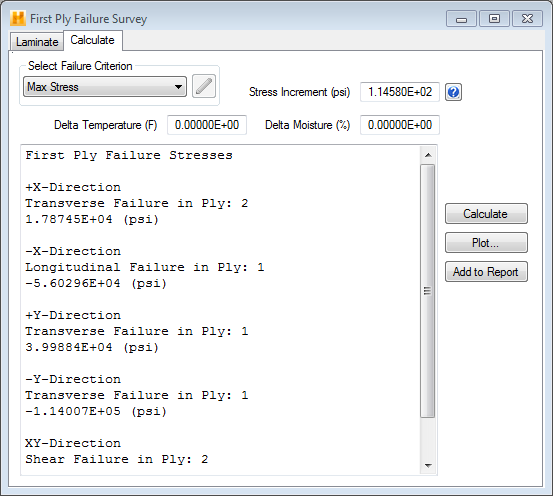
- Calculate Results - Use the Calculate tab (see image below) to define specific aspects of the First Ply Failure Survey analysis and then perform the analysis. This is done in three steps corresponding to the labels in the image below as follows:
- Select one of seven failure criteria available in the Select Failure Criterion drop-down menu that appears on the Calculate tab (labeled as '1' below). (See Appendix C for details on available failure criteria). If the selected failure criterion requires specification of additional parameters, the
 parameters button will become active. In this case, click the button to define the required parameters.
 - Specify the size of the stress increments to use in the First Ply Failure Survey analysis. This value can be entered in the Stress Increment box (labeled as '2' below) to control the resolution for determining the load at which first ply failure occurs. The default value is 1% of the lowest strength of any material in the laminate. The volume averaged stress in the laminate will begin at zero and increase by the stress increment value until first ply failure occurs.
- The First Ply Failure Survey analysis is performed by clicking the Calculate button under the Calculate tab (labeled as '3' below). The results of the analysis are displayed in the results window of the Calculate tab.
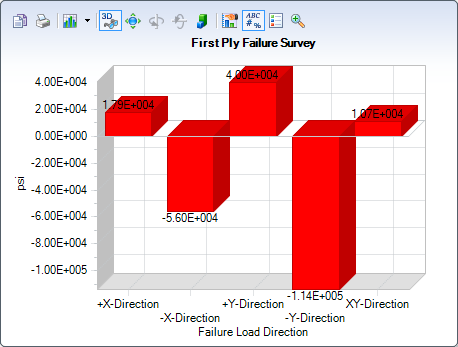
- Plot the results of the analysis in a bar graph by clicking Plot under the Calculate tab (labeled as '4' below). An example plot is shown at the bottom of the page.
- Select one of seven failure criteria available in the Select Failure Criterion drop-down menu that appears on the Calculate tab (labeled as '1' below). (See Appendix C for details on available failure criteria). If the selected failure criterion requires specification of additional parameters, the
The results of the First Ply Failure Survey analysis include the following:
- Volume averaged axial tensile strength, axial compressive strength, transverse tensile strength, transverse compressive strength, and in-plane shear strength of the laminate.
- First ply to fail in the laminate for each of the five fundamental volume averaged laminate strengths, and possibly the mode of failure if an applicable failure criterion is selected.

