-
Delete any existing preferences and use new defaults when launching.
- Display the Evaluation mode by selecting Display > Heads Up display > Evaluation
To test evaluation modes:
- Load your scene.
- In the Preferences window (Windows > Settings/Preferences > Preferences), select the Animation category (under Settings).
- Set the
Evaluation Mode menu to
DG to ensure you are in Dependency Graph (DG) mode.
DG mode was the previous default evaluation mode.
- Play the scene back in DG mode and take note of the frame rate.
- Switch to
Serial mode to ensure the scene evaluates correctly; take note of the frame rate.
Note: Sometimes scenes run more slowly in Serial mode than in DG mode. This is because Serial mode evaluates more nodes than DG mode.Note: Animation using FBIK reverts to Serial Evaluation as FBIK creates missing dependencies in the Evaluation Manager. As FBIK has been deprecated, use HIK for whole-body inverse kinematics and retargeting.
- If the scene looks correct, switch to
Parallel mode.
Note: If the scene looked wrong in Serial mode, it is unlikely to work properly in Parallel mode, as it uses the Evaluation schedule, but distributes computation across all available cores. Occasionally, improper evaluation in Serial mode is caused by custom plug-ins that use setDependentsDirty to manage attribute dirtying.)
- Next, while still in
Parallel mode, activate
GPU override
. If your scene has standard Maya deformers or your mesh's geometry is dense there may be a performance gain. Results vary based on deformers and density of meshes in your scenes.
Note: You can use the GPU override evaluator with either Serial or Parallel Evaluation modes, but GPU override does not work in VP1.
When analyzing speed:
- Use VP2.0 when you use GPU override evaluation mode. GPU override does not work in VP1.
- Disable VP2.0 Vertex Animation Cache to determine the speed gains between Directed Graph evaluation mode and the new evaluation modes. (To disable the VP2.0 Vertex Animation Cache, select Viewport 2.0 option > Vertex Animation Cache > Disable.) If VP2.0 Vertex Animation Cache is active, successive playbacks are quicker, skewing your analysis.
Troubleshoot Parallel Mode
Parallel scene evaluation takes advantage of all available computational resources to evaluate scenes more quickly. This is done by building an evaluation graph from the scene description using the dirty propagation mechanism.
For the evaluation graph to generate correct results, dependencies must be accurately expressed in the DG. If node dependencies are incorrect for your scene, parallel evaluation will produce wrong results, or Maya may crash.

A Safe Mode performs sanity tests when parallel evaluation is activated. This Safe Mode prevents the most common types of errors from invalid dependencies. If the Safe Mode detects errors, the Evaluation Manager reverts to Serial evaluation mode, as indicated in the HUD. One reason Safe Mode may revert to serial evaluation is if a node instance is evaluated by multiple threads simultaneously.
While Safe Mode catches many problems, it does not catch them all. Therefore, there is a new analysis mode to perform more thorough (and costly) checks of your scene to detect problems.
Also, Python performance issues can occur when evaluating other threads with custom Python nodes.
Analysis mode
Analysis mode is not meant for use by animators when playing back or manipulating the rig. Rather, it is designed for riggers and Technical Directors to troubleshoot evaluation problems when creating new rigs.
Analysis mode:
- Searches for errors at each playback frame - this is different from Safe Mode, which only tries to identify problems at the start of parallel execution.
- Monitors read-access to node attributes - this ensures that nodes have a correct dependency structure in the evaluation graph.
- Returns diagnostics to better understand which nodes influence evaluation - this mode currently only reports one destination node at a time.
Activate Analysis mode with the following command while in Serial mode:
dbtrace -k evalMgrGraphValid;To disable Analysis mode, type:
dbtrace -k evalMgrGraphValid -off;
Once activated, error detection occurs each time an evaluation is performed. Detected missing dependencies are then saved to a file in your machine's temporary folder. For example, on Windows, you would find results in %TEMP%\_MayaEvaluationGraphValidation.txt.
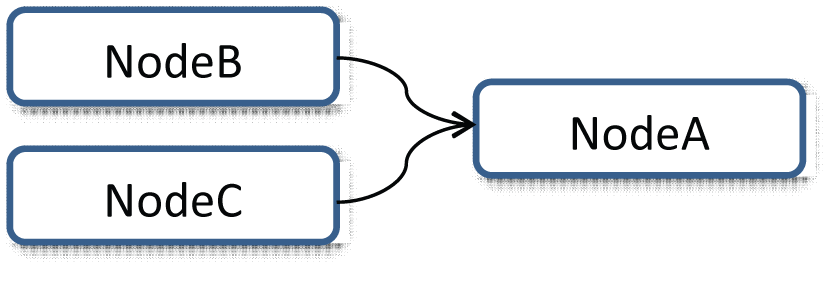
The following is an example report that shows missing dependencies between two nodes:
Detected missing dependencies on frame 56
{
NodeA.output <-x- NodeB
NodeA.output <-x- NodeC [cluster]
}
Detected missing dependencies on frame 57
{
NodeA.output <-x- NodeB
NodeA.output <-x- NodeC [cluster]
}
The "<-x-" symbol indicates the direction of the dependency. The "[cluster]" term indicates that the node is inside of a cycle cluster, which means that any of nodes from the cycles could be responsible for attribute access outside of evaluation order
In the above example, NodeB accesses the "output" attribute of NodeA, which is incorrect. These types of dependency do not appear in the Evaluation graph and could cause a crash when running an evaluation in Parallel mode.
Missing dependencies in Analysis mode
There are many reasons that missing dependencies occur, and how you handle them depends on the cause of the problem. If Analysis mode discovers errors in your scene from bad dependencies due to user plug-ins, revisit your strategy for managing dirty propagation in your node. Make sure that any attempts to use "clever" dirty propagation dirty the same attributes every time. Avoid using different notification messages to trigger pulling on attributes for recomputation.
See Locate animation bottlenecks with the Profiler for information on identifying problematic areas in animated scenes.