Cycle time
Two shot injection molding is a two step process that occurs simultaneously during one cycle of the injection molding process. The Cool (FEM) analysis is performed simultaneously on both the first shot and on the first-shot-and-second-shot combination. After the Cool (FEM) analysis is completed, other analyses such as a Fill + Pack and a Warp analysis can be run.When one cycle is done the mold opens. The first shot part is transferred to the second shot cavity and a new first shot component is injected in first shot cavity. The temperature from the first shot mesh is set as an initial condition for the overmolded mesh for the next cycle. And the first shot mesh is set as an initial melt temperature.
Example
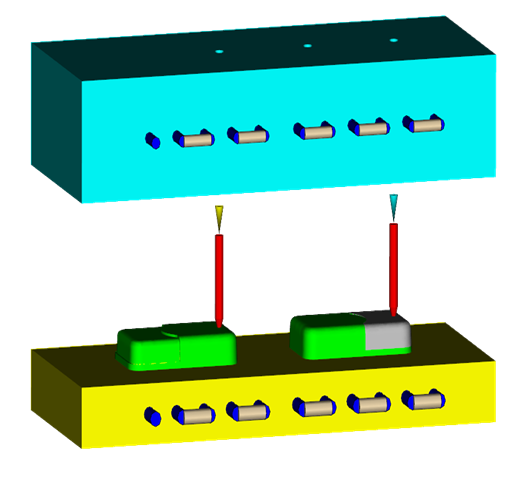
Figure 1: Overmolding model
In this example, the polymer material of both shots is Polypropylene and the mold is P20 tool steel. The melt temperature of the first shot is 240 degrees and the melt temperature of the second shot is 180 degrees. The cycle time is 30 seconds and the mold open time is 5 seconds.
An overmolding cycle time consists of the cycle before the platen rotates and the cycle after. For example, in the case previously described, the first cycle starts at 0 second and ends at 35 seconds, and the second cycle starts at 35 seconds and ends at 70 seconds. The overmolding cycle time is then 70 seconds and the results are shown through a 70-seconds cycle.
Interpreting the results
During a two shot sequential overmolding analysis, the mold rotates. However, the rotation is not simulated on the screen when the results are displayed. Thus, the results concerning the part circled in green in the Figure 2 are always represented on the left side of the screen for the whole overmolding cycle time.
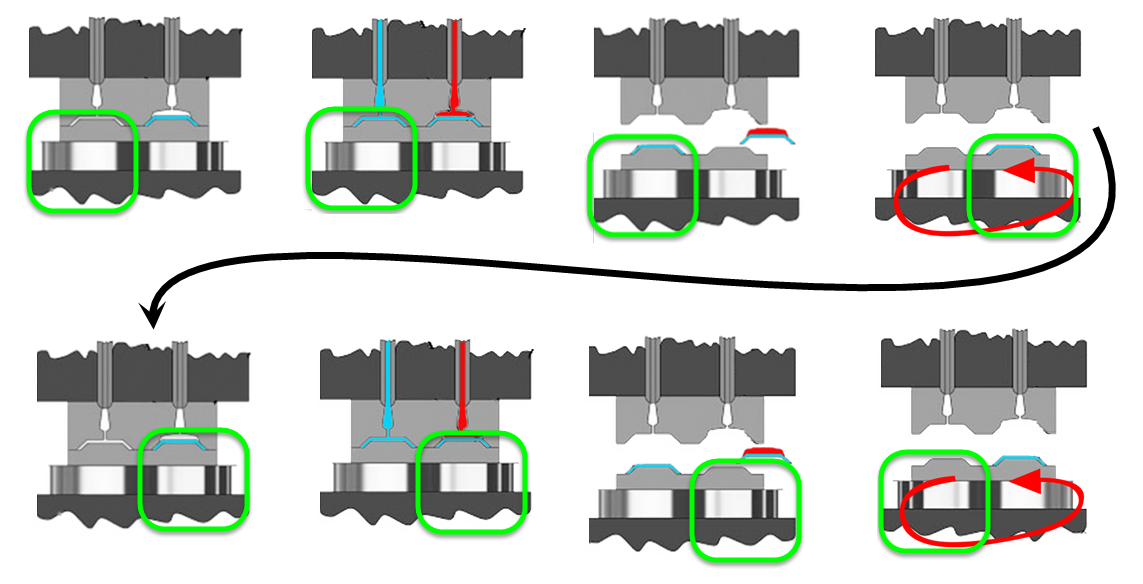
Figure 2: Two shot analysis Process
Let's take the example of the preceding model (Figure 1). The figure 3 and figure 4 show the temperature field plot of the rotational platen and stationary platen of two adjacent injection molding cycles.
In the Figure 3, the first line of results corresponds to a first cycle: the first shot is injected in the left-side cavity and the second shot is injected on the top of an existing first part in the right-side cavity. After this first cycle time, the rotational platen rotates, as shown in the Figure 2. The results displayed in the second line of the Figure 3 represent a second cycle time of an overmolding cycle time. The green part of the Figure 2 is represented in the left side of the screen.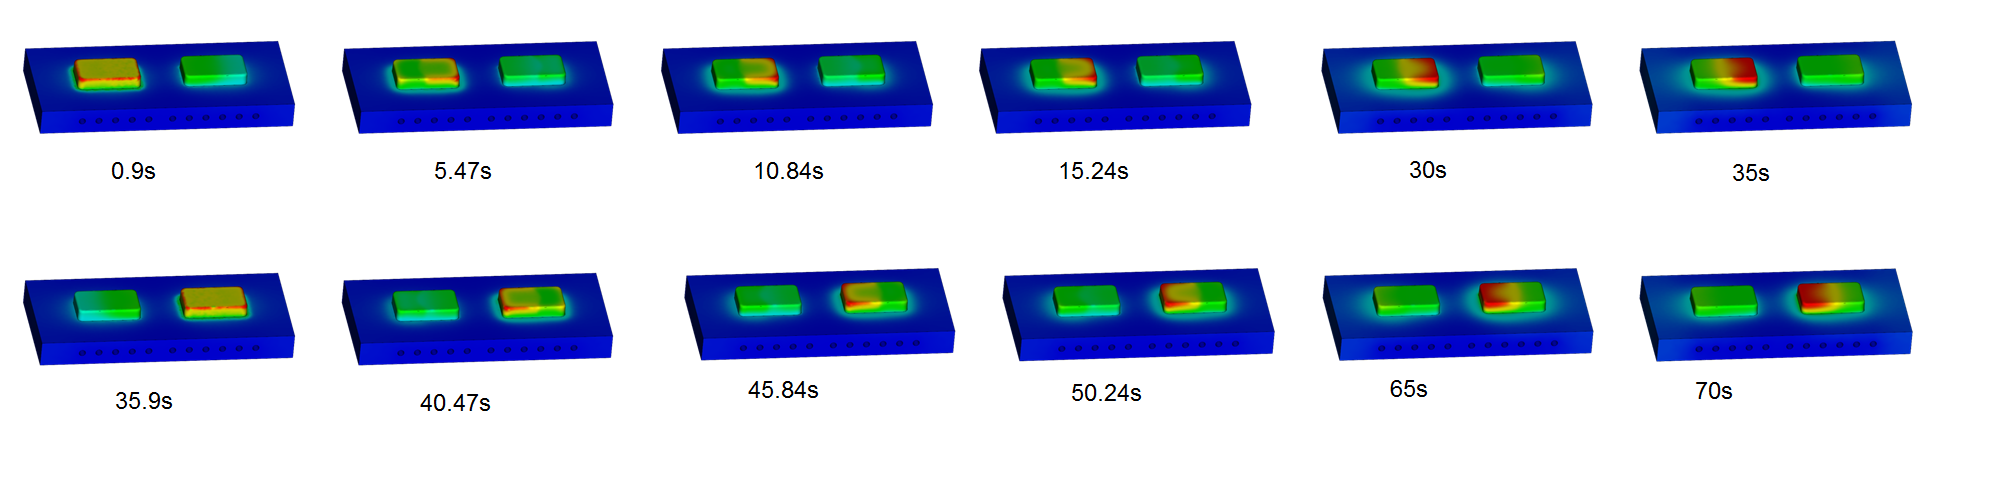
Figure 3: Mold temperature of rotational platen
The Figure 4 shows the temperature field plot of the stationary platen. Both cycles have identical temperature distribution as the stationary platen does not rotate.
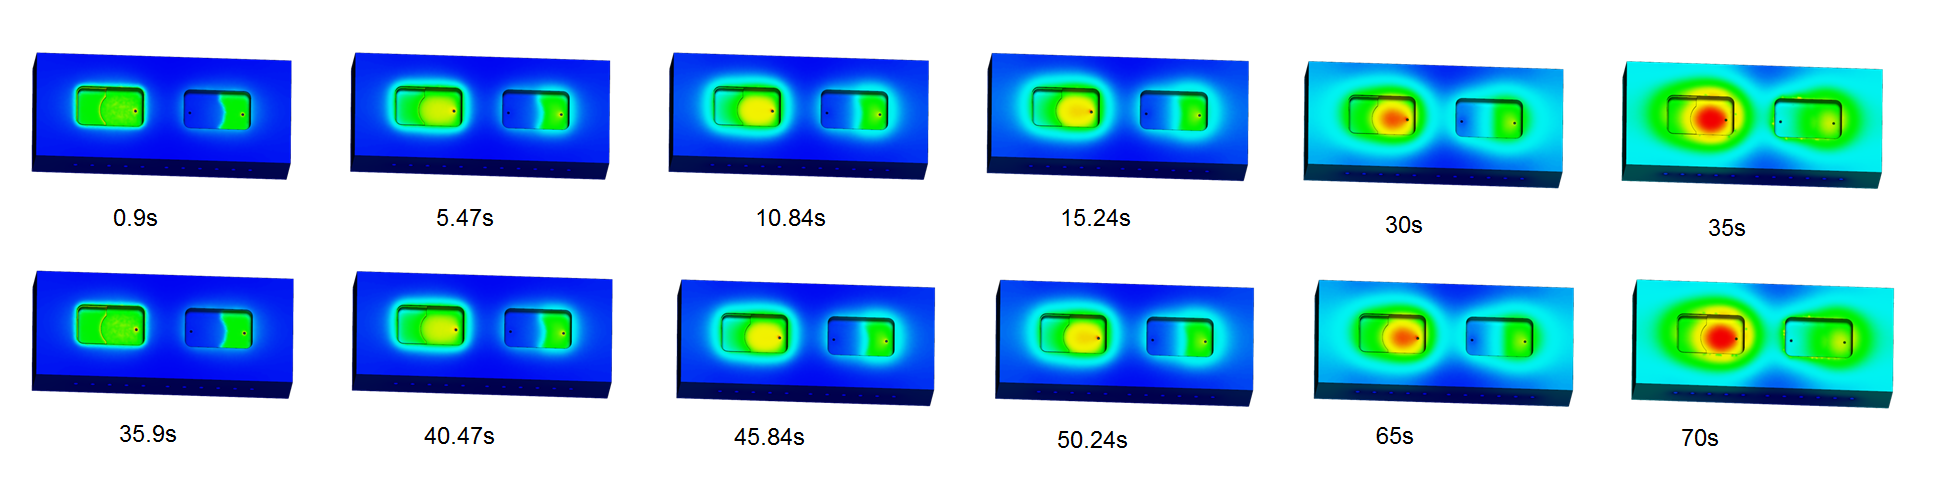
Figure 4: Mold temperature of stationary platen