Debug the Program
Running a program in Debug mode uses breakpoints to pause the program so that you can examine the state of variables and objects. If there is an error, you can check the variables as the program runs to deduce why the value is not what you might expect.
- In the Solution Explorer window, right-click the HelloWorld project to display a context menu.
- From the context menu, click Properties. The Properties window appears.
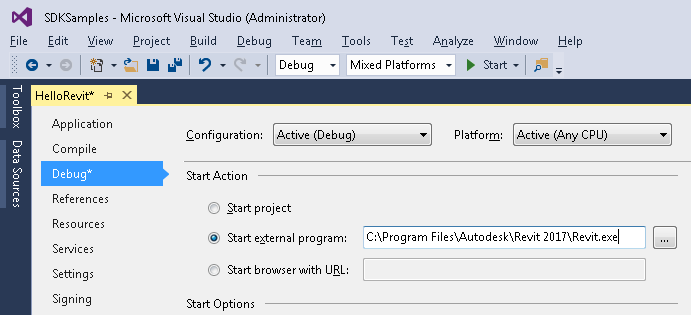
- Click the Debug tab.
- In the Debug window Start Action section, click Start external program and browse to the Revit.exe file. By default, the file is located at the following path, C:\Program Files\Autodesk\Revit 20XX\Revit.exe.

Figure 175: Set Debug environment
- From the Debug menu, select Toggle Breakpoint (or press F9) to set a breakpoint on the following line.
Code Region 30-11: TaskDialog
TaskDialog.Show("Revit", "Hello World") - Press F5 to start the debug procedure.
- Test the debugging
- On the Add-Ins tab, HelloWorld appears in the External Tools menu-button.

Figure 176: HelloWorld External Tools command
- Click HelloWorld to execute the program, activating the breakpoint.
- Press F5 to continue executing the program. The following system message appears.

Figure 177: TaskDialog message
- On the Add-Ins tab, HelloWorld appears in the External Tools menu-button.