In this step, we inspect the safety factor at the time step with the maximum stress value.
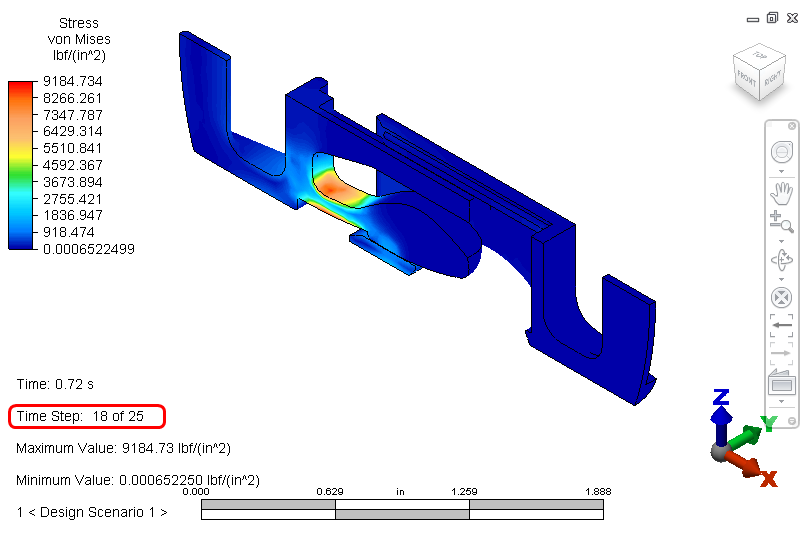
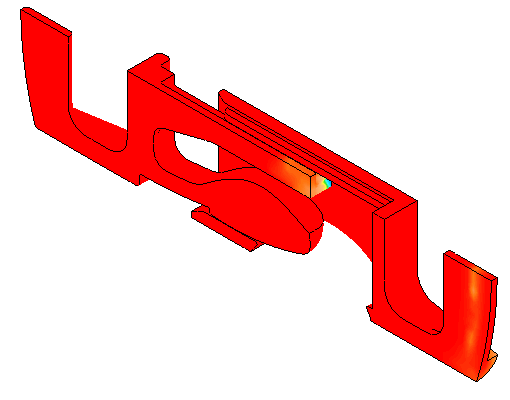
Continuing from the previous page, the Von Mises stress for Time Step 18 should be displayed as shown in the following image:
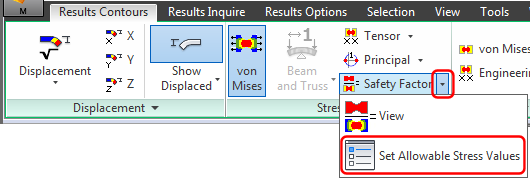
- Switch to the
Results Contours tab, and in the
Stress panel, click the arrow beside
Safety Factor, and click
Set Allowable Stress Values in the drop-down menu.
The following dialog box appears:
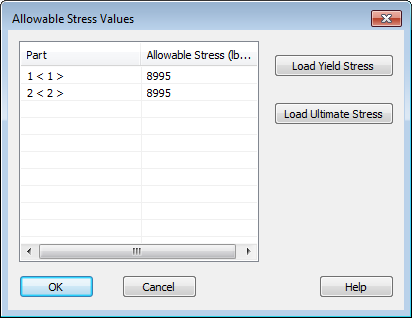
Note that the allowable stress values are already defined. By default, the allowable stress value of each material is set according to the yield strength. Alternatively, you can choose to base the safety factor results on the material ultimate strength. For the polycarbonate material used in this model, the ultimate stress is only very slightly greater than the yield strength. For metals, there is generally a much more significant difference between the yield and ultimate strength.
- Click OK to close the Allowable Stress Values dialog.
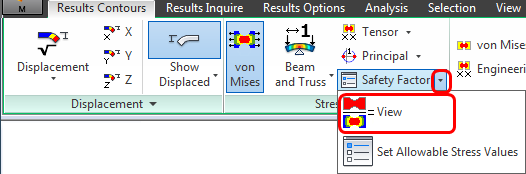
- Once again, click the arrow beside
Safety Factor
and this time, click
View in the drop-down menu.
You should see this:
- This plot doesn't show us much, so let's adjust the legend range:
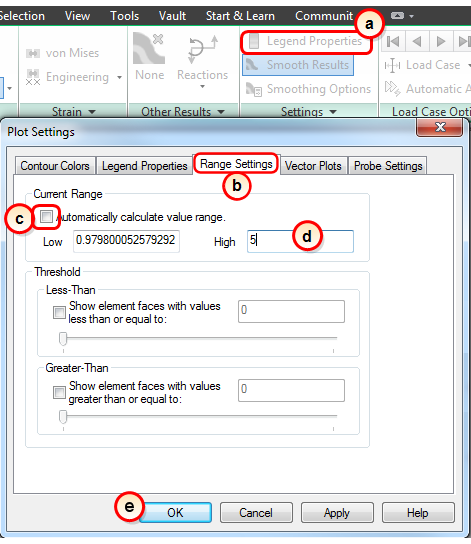
- Click Legend Properties.
- Go to the Range Settings tab.
- Uncheck Automatically calculate value range.
- Enter 5 as the High value.
- Click OK.
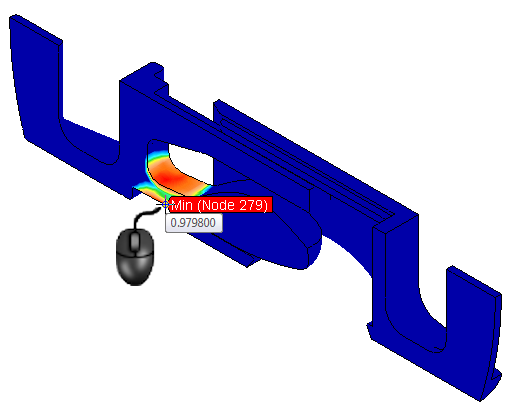
You should see this:
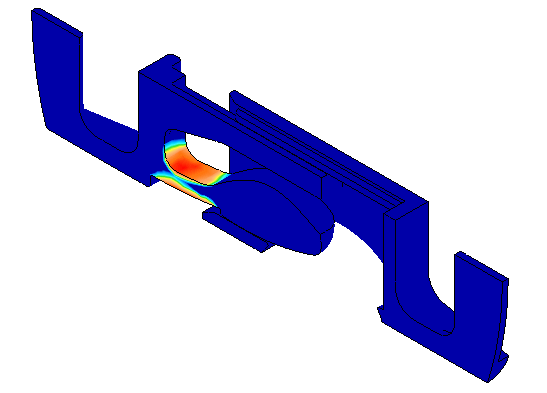
From the plot legend, we can see that the minimum safety factor is slightly less than 1, which indicates that the yield strength has been exceeded. The area of concern is where the latch finger on the clip bends. The spring clip is most likely to fail at this location.
- To precisely locate the minimum safety factor, and to probe for specific values, do the following:
- Click
Results Inquire Probes Minimum to place a probe on the node with the lowest safety factor. Notice that the node number is the same as previously identified as the maximum stress node.
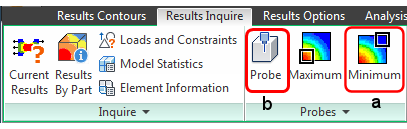
- Click
Results Inquire
 Probe, and hover the mouse in the region of the lowest safety factors (red areas). At the point of the
Minimum
probe, the probe tool shows the same value as you see at the bottom of the plot legend.
Probe, and hover the mouse in the region of the lowest safety factors (red areas). At the point of the
Minimum
probe, the probe tool shows the same value as you see at the bottom of the plot legend.
- Click
Results Inquire Probes Minimum to place a probe on the node with the lowest safety factor. Notice that the node number is the same as previously identified as the maximum stress node.
Wrap Up
In a few short minutes, you conducted a complete mechanical event simulation of a spring clip assembly. You assigned materials, contacts, and constraints, and created views that help to understand the behavior of the device.