- Right-click the Analysis Type heading in the browser (tree view) and select Edit Analysis Parameters.
- Click Analysis Data in the Analysis Parameters dialog box. The Random Vibration Analysis Input dialog box appears.
- Ensure that 1 is entered in the Use modal results from Design Scenario field. This simulation uses the modal results that were previously run in Design Scenario 1.
- Activate the g Squared/Hz vs. Freq (Hz) radio button.
- Type 0.05 in the Damping Ratio field.
- Click Import. The Import Data Table dialog box appears.
- Click Browse.
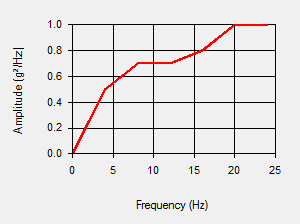
- Select the psd.csv file in your tutorial models folder. This file has a list of comma-separated values of frequency and amplitude representing the PSD we will use to analyze the model.
- Click Open. Keep the default Data Format and Delimiter settings.
- Click Import to load the data. The Frequency and Amplitude table is populated and the PSD curve displays as shown in the following image.

- Click OK to accept the PSD settings.
- Click OK to accept the analysis parameters.
Next
