- Click
 Setup
Setup Model Setup Parameters.
- Type 36 in the Number of time steps field.
- Click OK. Results for the 360° crank rotation event will be output in 10° increments (360°/36).
- Click
 Analysis Analysis Run Simulation. After solid meshing, the analysis proceeds, and the model is displayed in the Results environment while the simulation progresses. The displacement magnitude is presented initially, by default.
- If the load and constraint symbols are visible, click
 Results Options View Loads and Constraints to hide them.
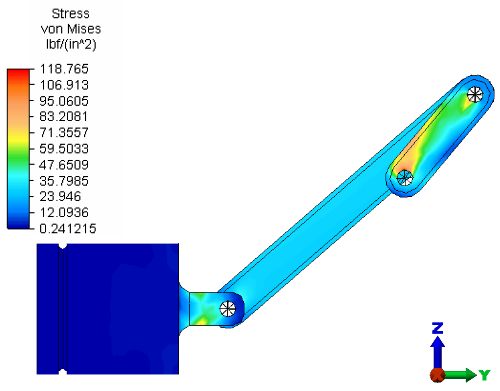
- Double-click the Stress heading under Saved Presentations in the browser (tree view) to open a Von Mises stress presentation.
While the solution is running, the Output Bar displays the solution log. Alternatively, you can click on the Convergence Plot tab to see a graph of the convergence behavior for the solution. While viewing the Details tab, use the drop-down menu at the right end of the Output Bar to choose between the solution log (View Solve Log) and analysis summary (View Summary). While viewing the Convergence Plot tab, use the drop-down menus at the right end of the Output Bar to choose the values to plot on the X and Y axes of the graph. For a better view of the model, you can unpin the Output Bar, causing it to auto-hide. When unpinned, the Output Bar will open when the cursor is at the bottom of the model display canvas. Click the pushpin icon at the right end of the title bar to unpin or re-pin the Output Bar.
This analysis can take a significant amount of time to finish, depending on your computer resources. An archive with results, Piston Results.ach, is available in your tutorial models folder. You can use this file, if desired, to review the results without having to run the analysis to completion. The Von Mises stress results at Time Step 5 are shown below.